I am trying to display two different datasets as histograms on the same Canvas and have the TPaveStats object that is created display the stats for each dataset. I know that if you do: hist2.Draw(“sames”) it is supposed to draw in another stat box for the 2nd histogram however when I do this I am getting the exact same stats as the first one that is generated. I know there have been a few topics about this but I have tried their suggestions and nothing has worked, I am trying just a simple example currently. Any suggestions are very appreciated!
the problem is that your second TPaveStats object sits right on top of the first one, so you need to move this second TPaveStats object away from the first one.
Hello, I know that they are located one on top of another and I know how to move them initially but the problem is that they display the same stats when they shouldn’t as they are two different datasets.
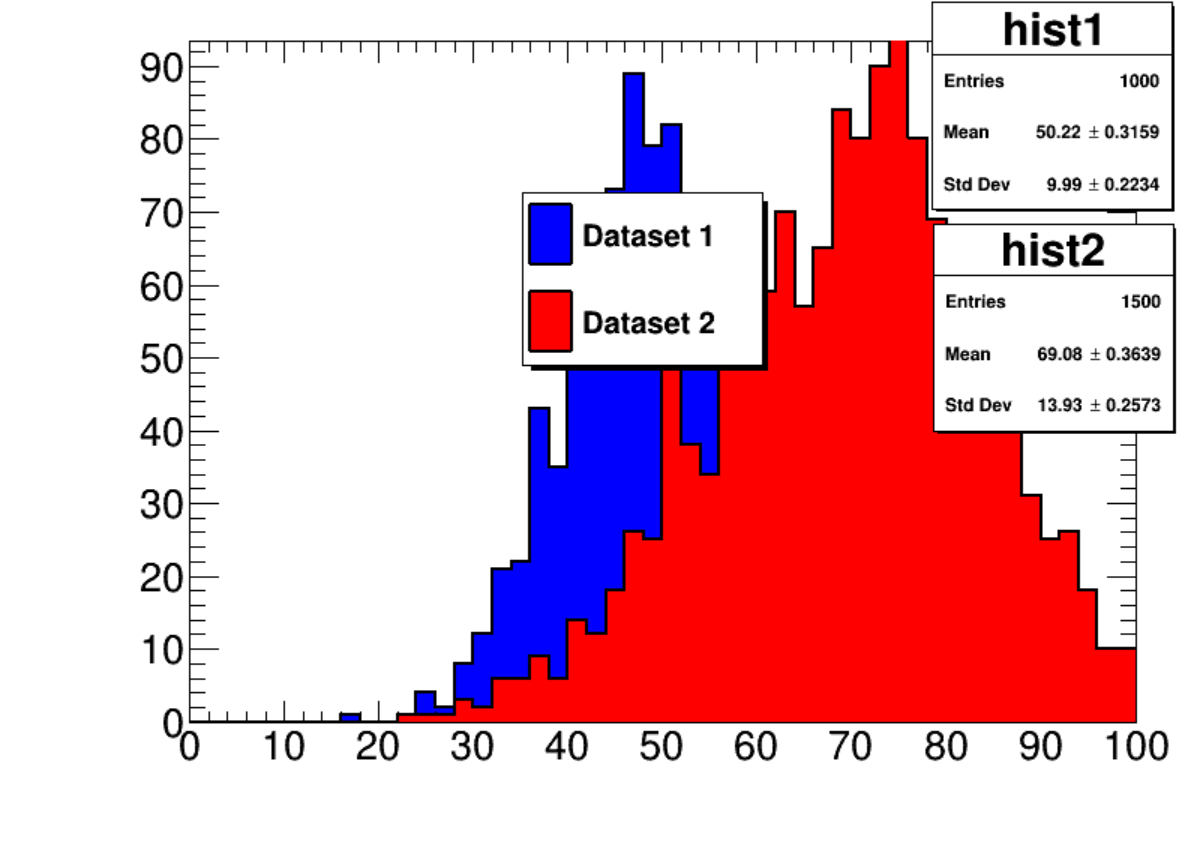
Could you please send a screenshot indicative of the issue? Here is what I get with your code (after having moved the stat boxes and the legend around):
From what I could understand of the stats box moving yes but I am not defining separate pads and displaying them on different pads so I don’t know if I need to do that or not as I don’t have different scales to use. Also I still don’t understand why it would work if I save the canvas immediately as a .png but not as a root file.
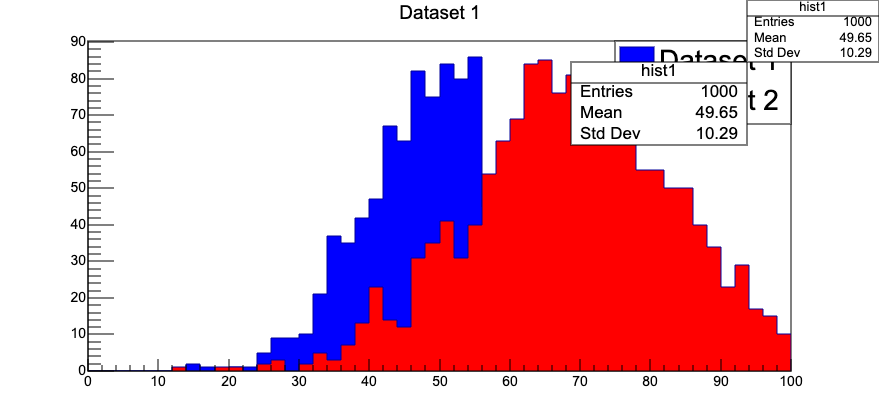
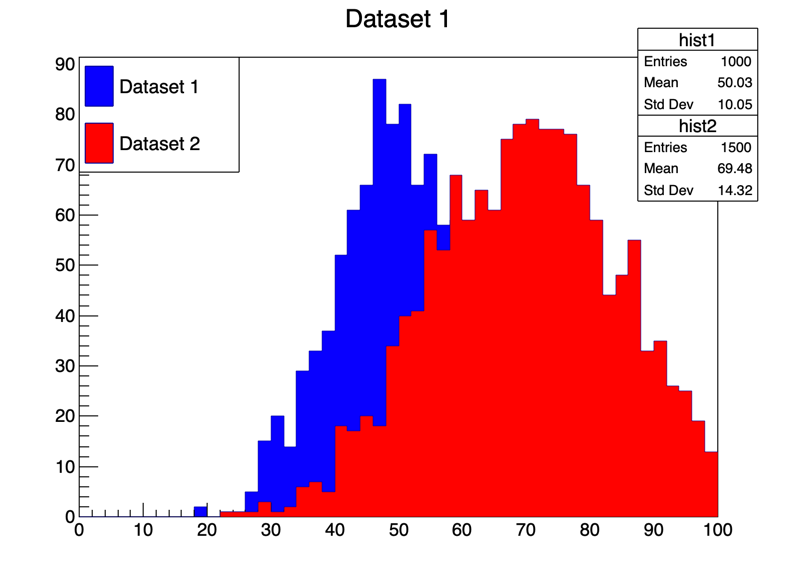
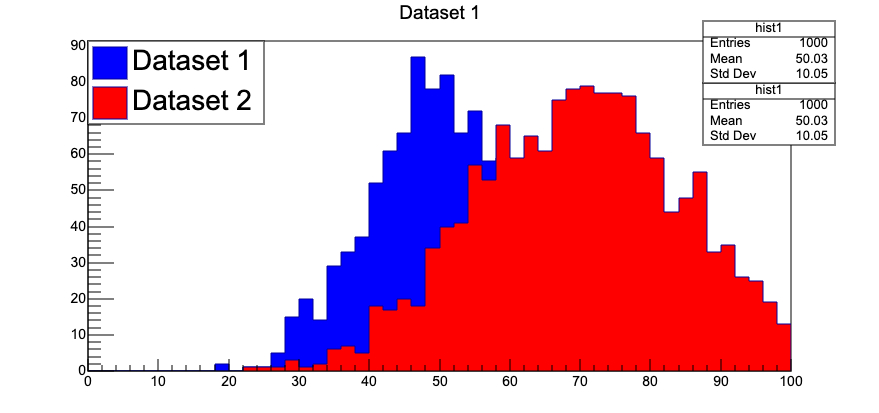
Yes when I do that, I get the result as above, where when I launch it in TBrowser the stat boxes are incorrect but if I save it directly as any file extension type, it is populated correctly.