I have 3 two-dimensional histograms. And I want to draw the first histogram using colz option, which gives me the general information about the plot with colors. Now using the other 2 histograms I want to print the text information of each of them on the same canvas. Something like below:
However, as expected this prints the text from h2 overwriting the one from h1. Is there a way that I can write both the numbers from h1 and h2 in each bin of h in a readable way (something like splitting the bins diagonally and write the numbers in the split parts) ?
Unfortunately no. Anyway, since I didn’t find a support to this - I used TPavetext, got the bin entries written to it and put them on the plot with the respective positions.
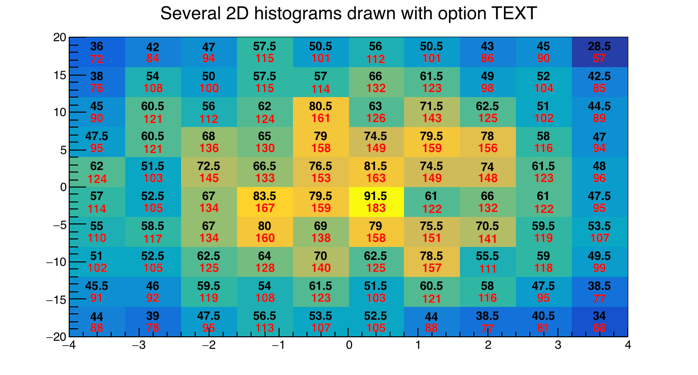
Since ROOT version 6.07/07: In case several histograms are drawn on top ot each other (using option SAME), the text can be shifted using SetBarOffset(). It specifies an offset for the text in percentage of the bin width.
{
   TCanvas *c03 = new TCanvas("c03","c03",700,400);
   gStyle->SetOptStat(0);
   TH2F *htext3 = new TH2F("htext3","Several 2D histograms drawn with option TEXT",10,-4,4,10,-20,20);
   TH2F *htext4 = new TH2F("htext4","htext4",10,-4,4,10,-20,20);
   TH2F *htext5 = new TH2F("htext5","htext5",10,-4,4,10,-20,20);
   Float_t px, py;
   for (Int_t i = 0; i < 25000; i++) {
      gRandom->Rannor(px,py);
      htext3->Fill(4*px,20*py,0.1);
      htext4->Fill(4*px,20*py,0.5);
      htext5->Fill(4*px,20*py,1.0);
   }
   //gStyle->SetPaintTextFormat("4.1f m");
   htext4->SetMarkerSize(1.8);
   htext5->SetMarkerSize(1.8);
   htext5->SetMarkerColor(kRed);
   htext3->Draw("COL");
   htext4->SetBarOffset(0.2);
   htext4->Draw("TEXT SAME");
   htext5->SetBarOffset(-0.2);
   htext5->Draw("TEXT SAME");
   return c03;
}