Hello there!
I need help with some plotting. I know this might be too trivial for some of you but I struggle with it a lot.
I have four 2D graphs
Pip;
piT;
fireball;
surface;
I successfully loaded data from the file and processed it. So I guess there is no need for posting the code but I can provide it.
Here are the graphs:
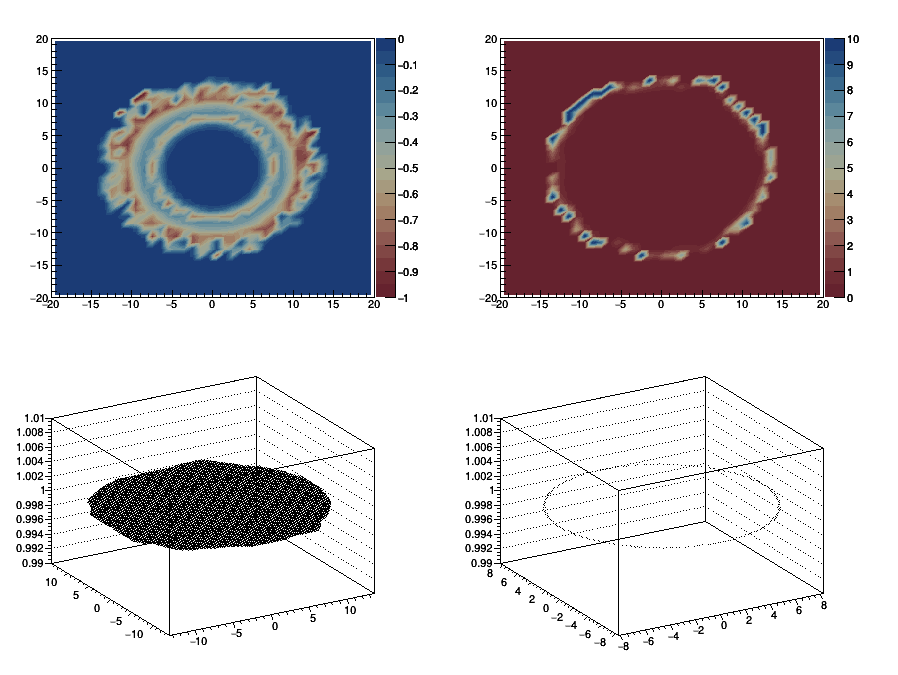
Pip - top left
piT - top right
fireball - bottom left
surface - bottom right
The fireball and surface have only 1 (non-zero) value. Let’s ignore piT (top right) because I would be able to figure out what to do as soon as I’ll know what to do with the Pip (top left).
Note: the view of the final plot would be from the top same as Pip and piT in the example
- So I’d like to plot
fireballwith one color (or two - one for fireball=1 and second for vacuum=0) [i.e. 1->Blue, 0->Black] - Then I’d like to put
Pipon top of that using contour, zero values wouldn’t be displayed so you can see thefireballarea - Also I’d like to have the z-axis of
Pipdisplayed on the right next to the plot (same as in the example) - Finally, I’d like to plot
surfaceon top of that as a red circle (maybe also a little bit transparent if possible)
So the final result should look like that (grey notes not included, red possibly a little bit transparent)
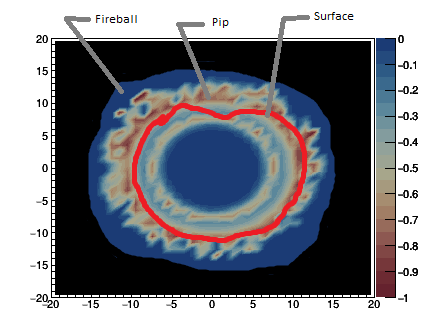
The only thing I know is I have to use the option "same" to plot more graphs but I’m even struggling to plot fireball and surface as described. This is how I made the plot on top of this post:
c->cd(1);
Pip[i]->Draw("CONT4Z");
c->cd(2);
piT[i]->Draw("CONT4Z");
gStyle->SetPalette(95);
c->cd(3);
fireball[i]->Draw("PFC");
c->cd(4);
surface[i]->Draw("PLC");
Thanks a lot if you help me in any way!