faca87
June 18, 2021, 8:35am
1
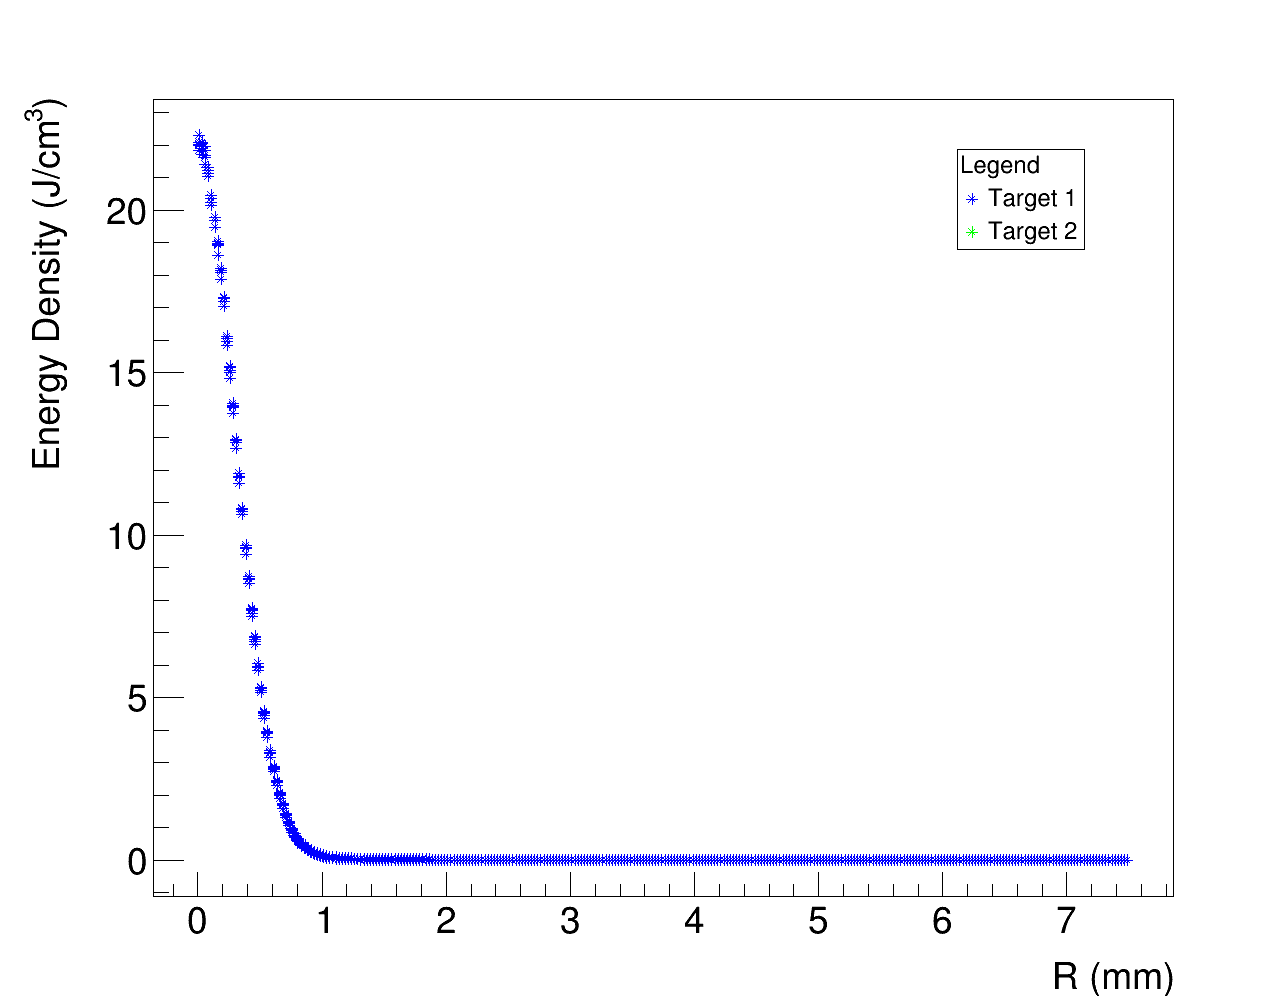
Hello, I’m doing a multigraph, but I get two errors
It draws the graph1, but it doesn’t the graph2
root [0] .x densities.cpp
Error in <TGraphPainter::PaintGraph>: illegal number of points (0)
Error in <TGraphPainter::PaintGraph>: illegal number of points (0)
Error in <TGraphPainter::PaintGraph>: illegal number of points (0)
Info in <TCanvas::Print>: png file simulazione/densities.png has been created
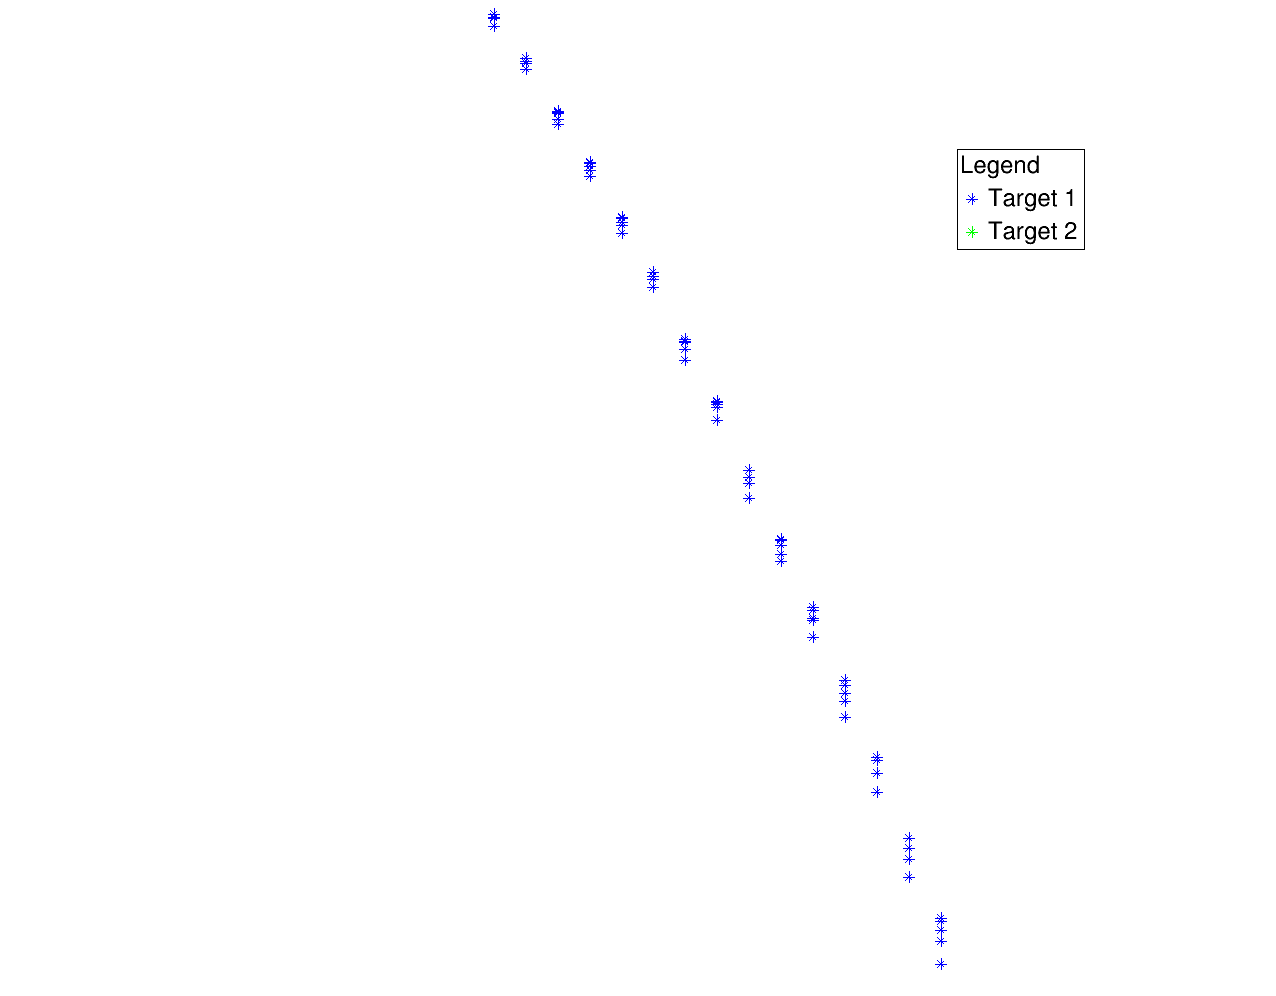
2.Moreover, If I set the Logy it doesn’t print the axes
root [1] .x densities.cpp
Warning in <TCanvas::Constructor>: Deleting canvas with same name: c01
Error in <THistPainter::PaintInit>: log scale requested with a negative argument (-1.114438)
Error in <TGraphPainter::PaintGraph>: illegal number of points (0)
Error in <THistPainter::PaintInit>: log scale requested with a negative argument (-1.114438)
Error in <TGraphPainter::PaintGraph>: illegal number of points (0)
Error in <THistPainter::PaintInit>: log scale requested with a negative argument (-1.114438)
Error in <TGraphPainter::PaintGraph>: illegal number of points (0)
Info in <TCanvas::Print>: png file simulazione/densities.png has been created
Maybe the II error (the log) is related to the presence of some 0 values?? But in this case, shouldn’t it just neglet these values?
Here macro and data
densities.cpp (2.0 KB)densities.txt (62.3 KB)
Please read tips for efficient and successful posting and posting code
ROOT Version: Not ProvidedPlatform: Not ProvidedCompiler: Not Provided
couet
June 18, 2021, 8:49am
2
void densities() {
   const char *datain = "densities.txt";

   TCanvas *c01 = new TCanvas("c01","multigraph",1280,1024);
   auto mg = new TMultiGraph();
   float offx=1.3;
   float offy=1.3;
   float margr=0.08;
   float w=3;
   float margl=0.12;
   float line=2;
   gPad->SetLeftMargin(margl);
   gPad->SetRightMargin(margr);
   TGraph *graph1 = new TGraph(datain,"%lg %lg %*lg");
   TGraph *graph2 = new TGraph(datain,"%lg %*lg %lg");

printf("%d %d \n",graph1->GetN(),graph2->GetN() );

   graph1->SetMarkerColor(kBlue);
   graph1->SetLineColor(kBlue);
   graph1->SetMarkerStyle(3);
   graph1->SetMarkerSize(1.3);
   graph1->SetLineWidth(line);
   mg->Add(graph1);

   graph2->SetMarkerColor(kGreen);
   graph2->SetLineColor(kGreen);
   graph2->SetMarkerStyle(3);
   graph2->SetMarkerSize(1.3);
   graph2->SetLineWidth(line);
   mg->Add(graph2);

   mg->SetTitle("");
   mg->GetXaxis()->SetTitle("R (mm)");
   mg->GetYaxis()->SetTitle("Energy Density (J/cm^{3})");
   mg->GetYaxis()->SetTitleOffset(offy);
   mg->GetXaxis()->SetTitleOffset(offx);
   mg->GetYaxis()->SetTitleSize(40);
   mg->GetYaxis()->SetTitleFont(43);
   mg->GetYaxis()->SetLabelFont(43);
   mg->GetYaxis()->SetLabelSize(40);
   mg->GetXaxis()->SetTitleSize(40);
   mg->GetXaxis()->SetTitleFont(43);
   mg->GetXaxis()->SetLabelFont(43);
   mg->GetXaxis()->SetLabelSize(40);
   mg->Draw("ap");

///   graph1->GetXaxis()->SetNdivisions(10); //numero di punti * 2 (
   TLegend* leg = new TLegend(0.75, 0.75, .85, .85);
   leg->SetHeader("Legend");
   leg->SetNColumns(1);
   leg->AddEntry(graph1, "Target 1", "ap");
   leg->AddEntry(graph2, "Target 2", "ap");
   leg->Draw();

}
faca87
June 18, 2021, 8:58am
3
Thank you @couet , it works for the linear scale, but I still get the error for the log one…
is there a way to solve it too?
couet
June 18, 2021, 9:12am
4
The error message tells you the problem. You have negative values on Y:
root [1] Error in <THistPainter::PaintInit>: log scale requested with a negative argument (-1.117727)
faca87
June 18, 2021, 10:41am
5
Hello @couet , no…I don’t have negative numbers (you can see the data)…I’ve the 0, but I think it should neglets the 0
couet
June 18, 2021, 10:56am
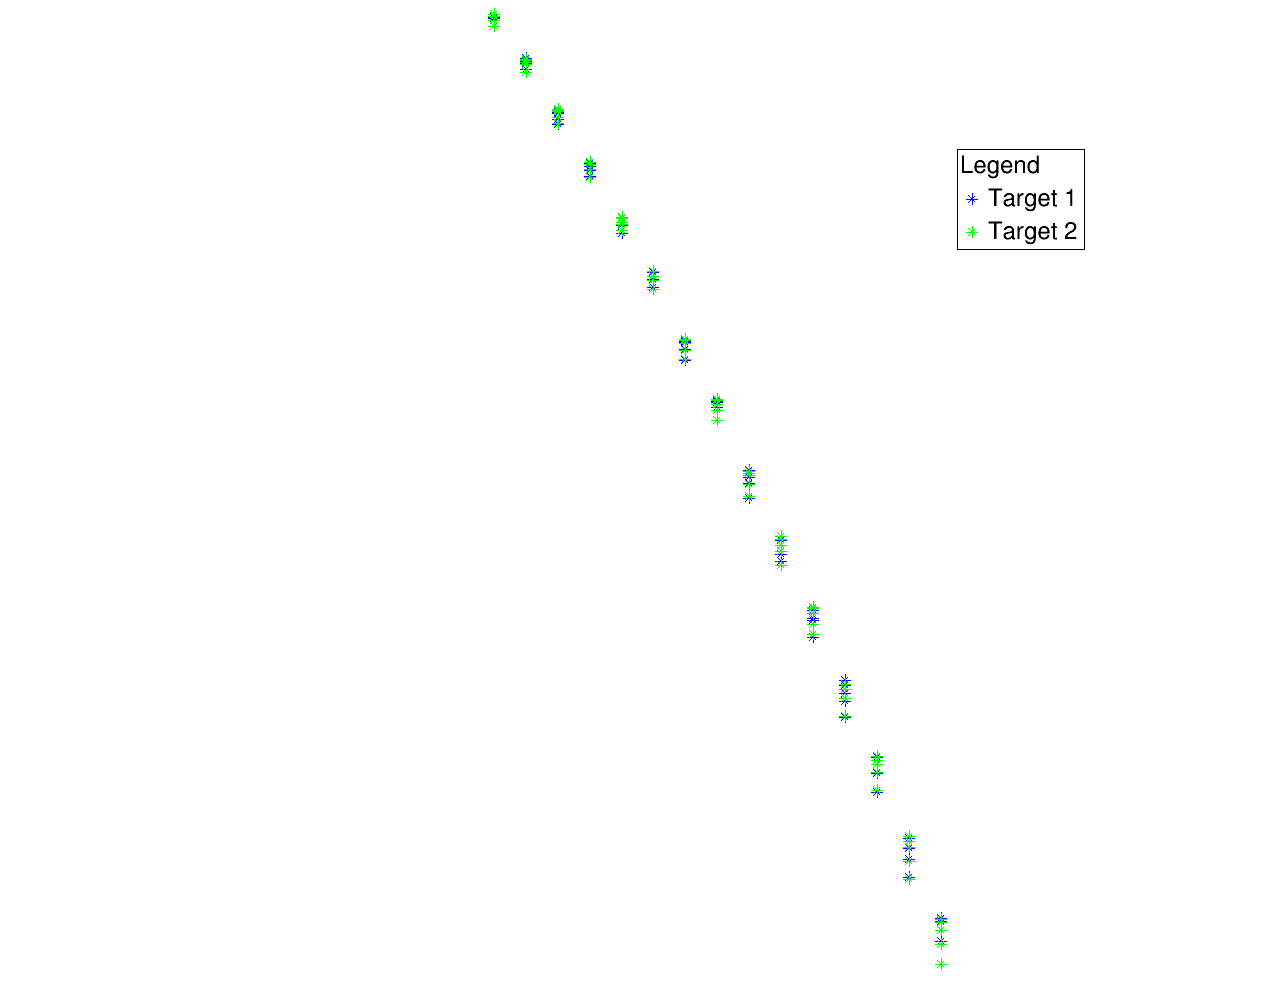
6
void densities() {
   const char *datain = "densities.txt";

   TCanvas *c01 = new TCanvas("c01","multigraph",1280,1024);
   c01->SetLogy();

   auto mg = new TMultiGraph();
   float offx=1.3;
   float offy=1.3;
   float margr=0.08;
   float w=3;
   float margl=0.12;
   float line=2;
   gPad->SetLeftMargin(margl);
   gPad->SetRightMargin(margr);
   TGraph *graph1 = new TGraph(datain,"%lg %lg %*lg");
   TGraph *graph2 = new TGraph(datain,"%lg %*lg %lg");

   graph1->SetMarkerColor(kBlue);
   graph1->SetLineColor(kBlue);
   graph1->SetMarkerStyle(3);
   graph1->SetMarkerSize(1.3);
   graph1->SetLineWidth(line);
   mg->Add(graph1);

   graph2->SetMarkerColor(kGreen);
   graph2->SetLineColor(kGreen);
   graph2->SetMarkerStyle(3);
   graph2->SetMarkerSize(1.3);
   graph2->SetLineWidth(line);
   mg->Add(graph2);

   mg->SetTitle("");
   mg->GetXaxis()->SetTitle("R (mm)");
   mg->GetYaxis()->SetTitle("Energy Density (J/cm^{3})");
   mg->GetYaxis()->SetTitleOffset(offy);
   mg->GetXaxis()->SetTitleOffset(offx);
   mg->GetYaxis()->SetTitleSize(40);
   mg->GetYaxis()->SetTitleFont(43);
   mg->GetYaxis()->SetLabelFont(43);
   mg->GetYaxis()->SetLabelSize(40);
   mg->GetXaxis()->SetTitleSize(40);
   mg->GetXaxis()->SetTitleFont(43);
   mg->GetXaxis()->SetLabelFont(43);
   mg->GetXaxis()->SetLabelSize(40);
   mg->SetMinimum(0.0000001);
   mg->Draw("ap");

   TLegend* leg = new TLegend(0.75, 0.75, .85, .85);
   leg->SetHeader("Legend");
   leg->SetNColumns(1);
   leg->AddEntry(graph1, "Target 1", "ap");
   leg->AddEntry(graph2, "Target 2", "ap");
   leg->Draw();

}
faca87
June 18, 2021, 11:47am
7
Thank you @couet it works!