faca87
April 20, 2021, 6:40am
1
Hello, I wrote this macro to plot a multigraph reading data from a .txt filemulgr.cpp (1.8 KB)
This is the data filedata.txt (183 Bytes)
gr1 must plot the data of second culumn in function of first one of data file
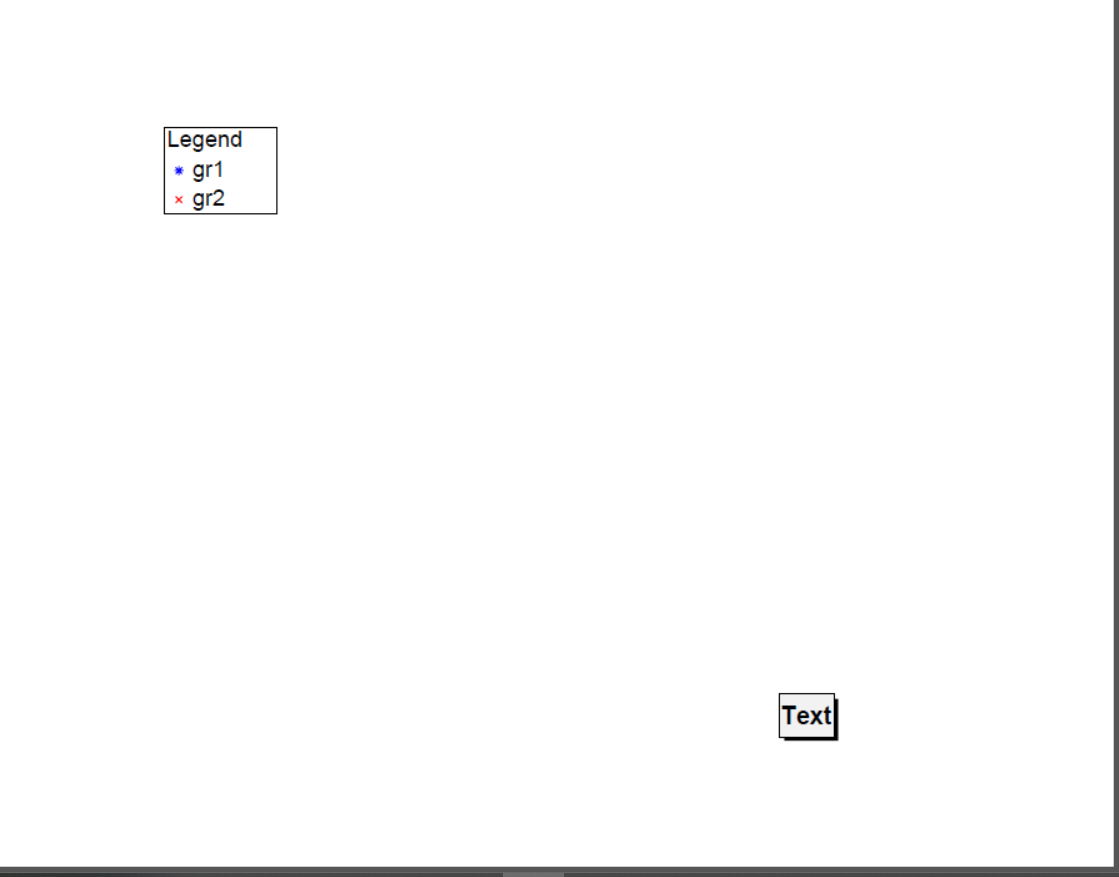
but when I run the macro, I don’t get the plots, but just the legend and the text bloxes…
Please read tips for efficient and successful posting and posting code
_ROOT Version:6.25.01
faca87
April 20, 2021, 11:08am
4
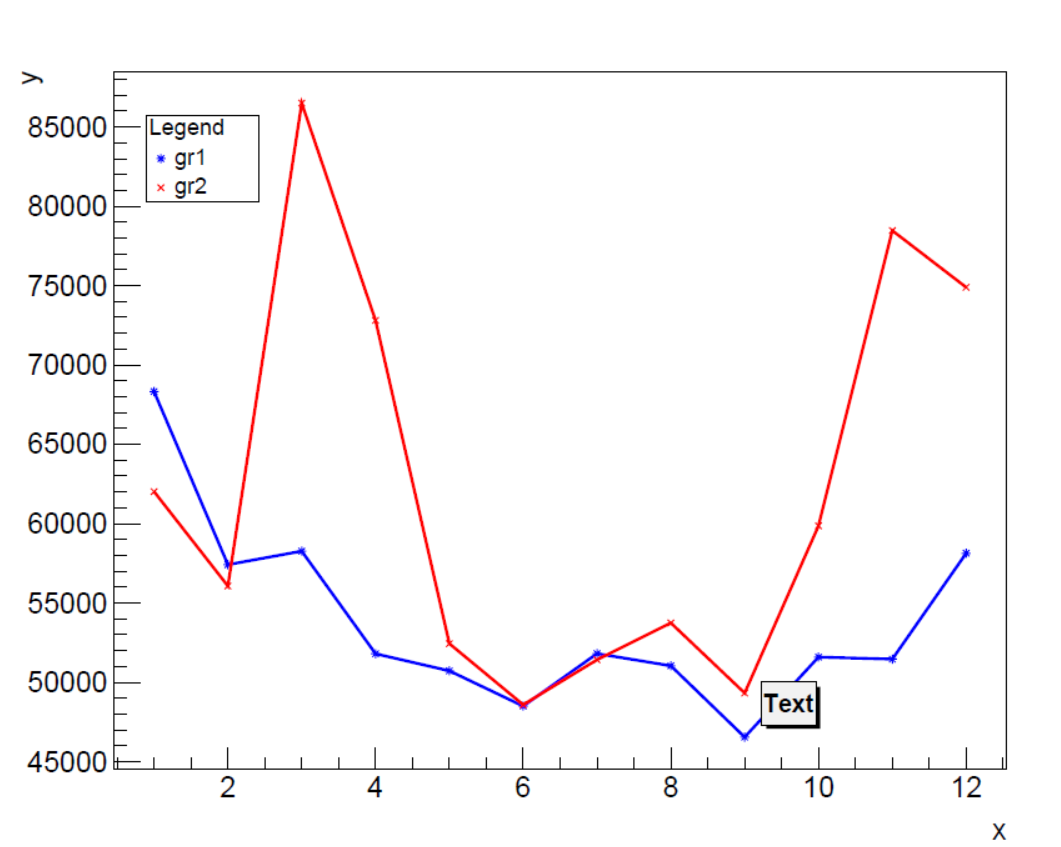
Hello @couet thank you, it worked and now I get correctly the plot
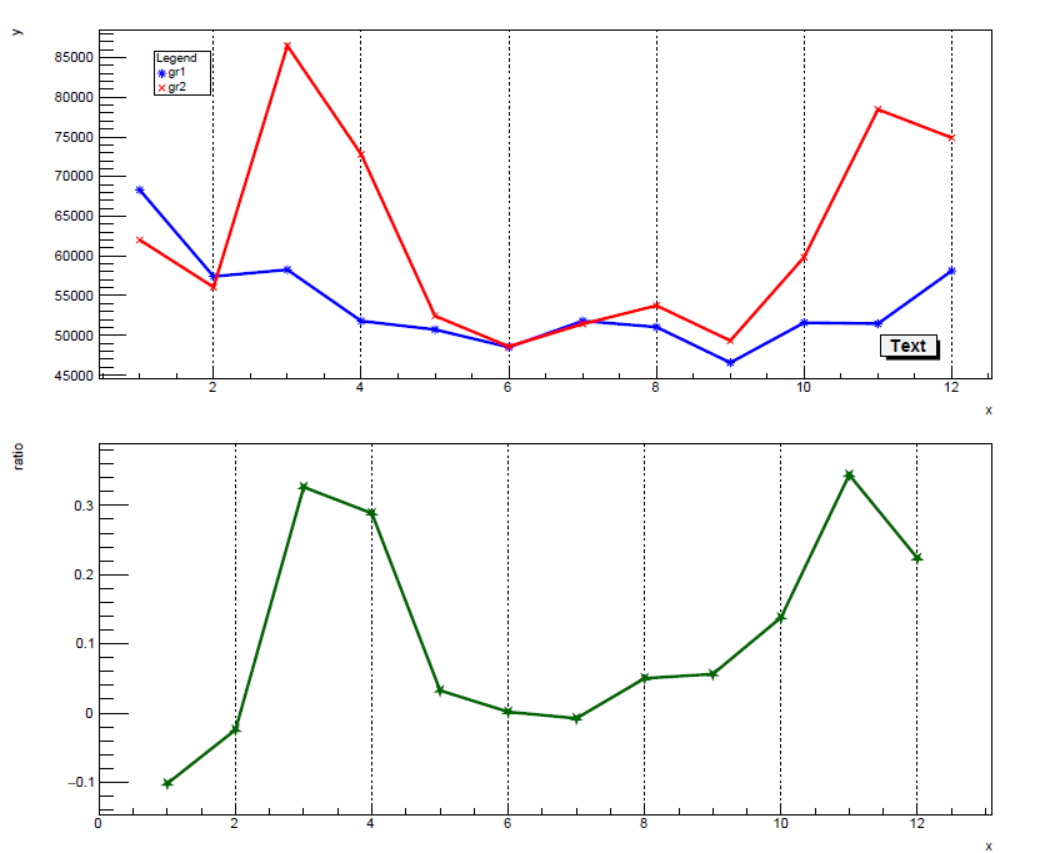
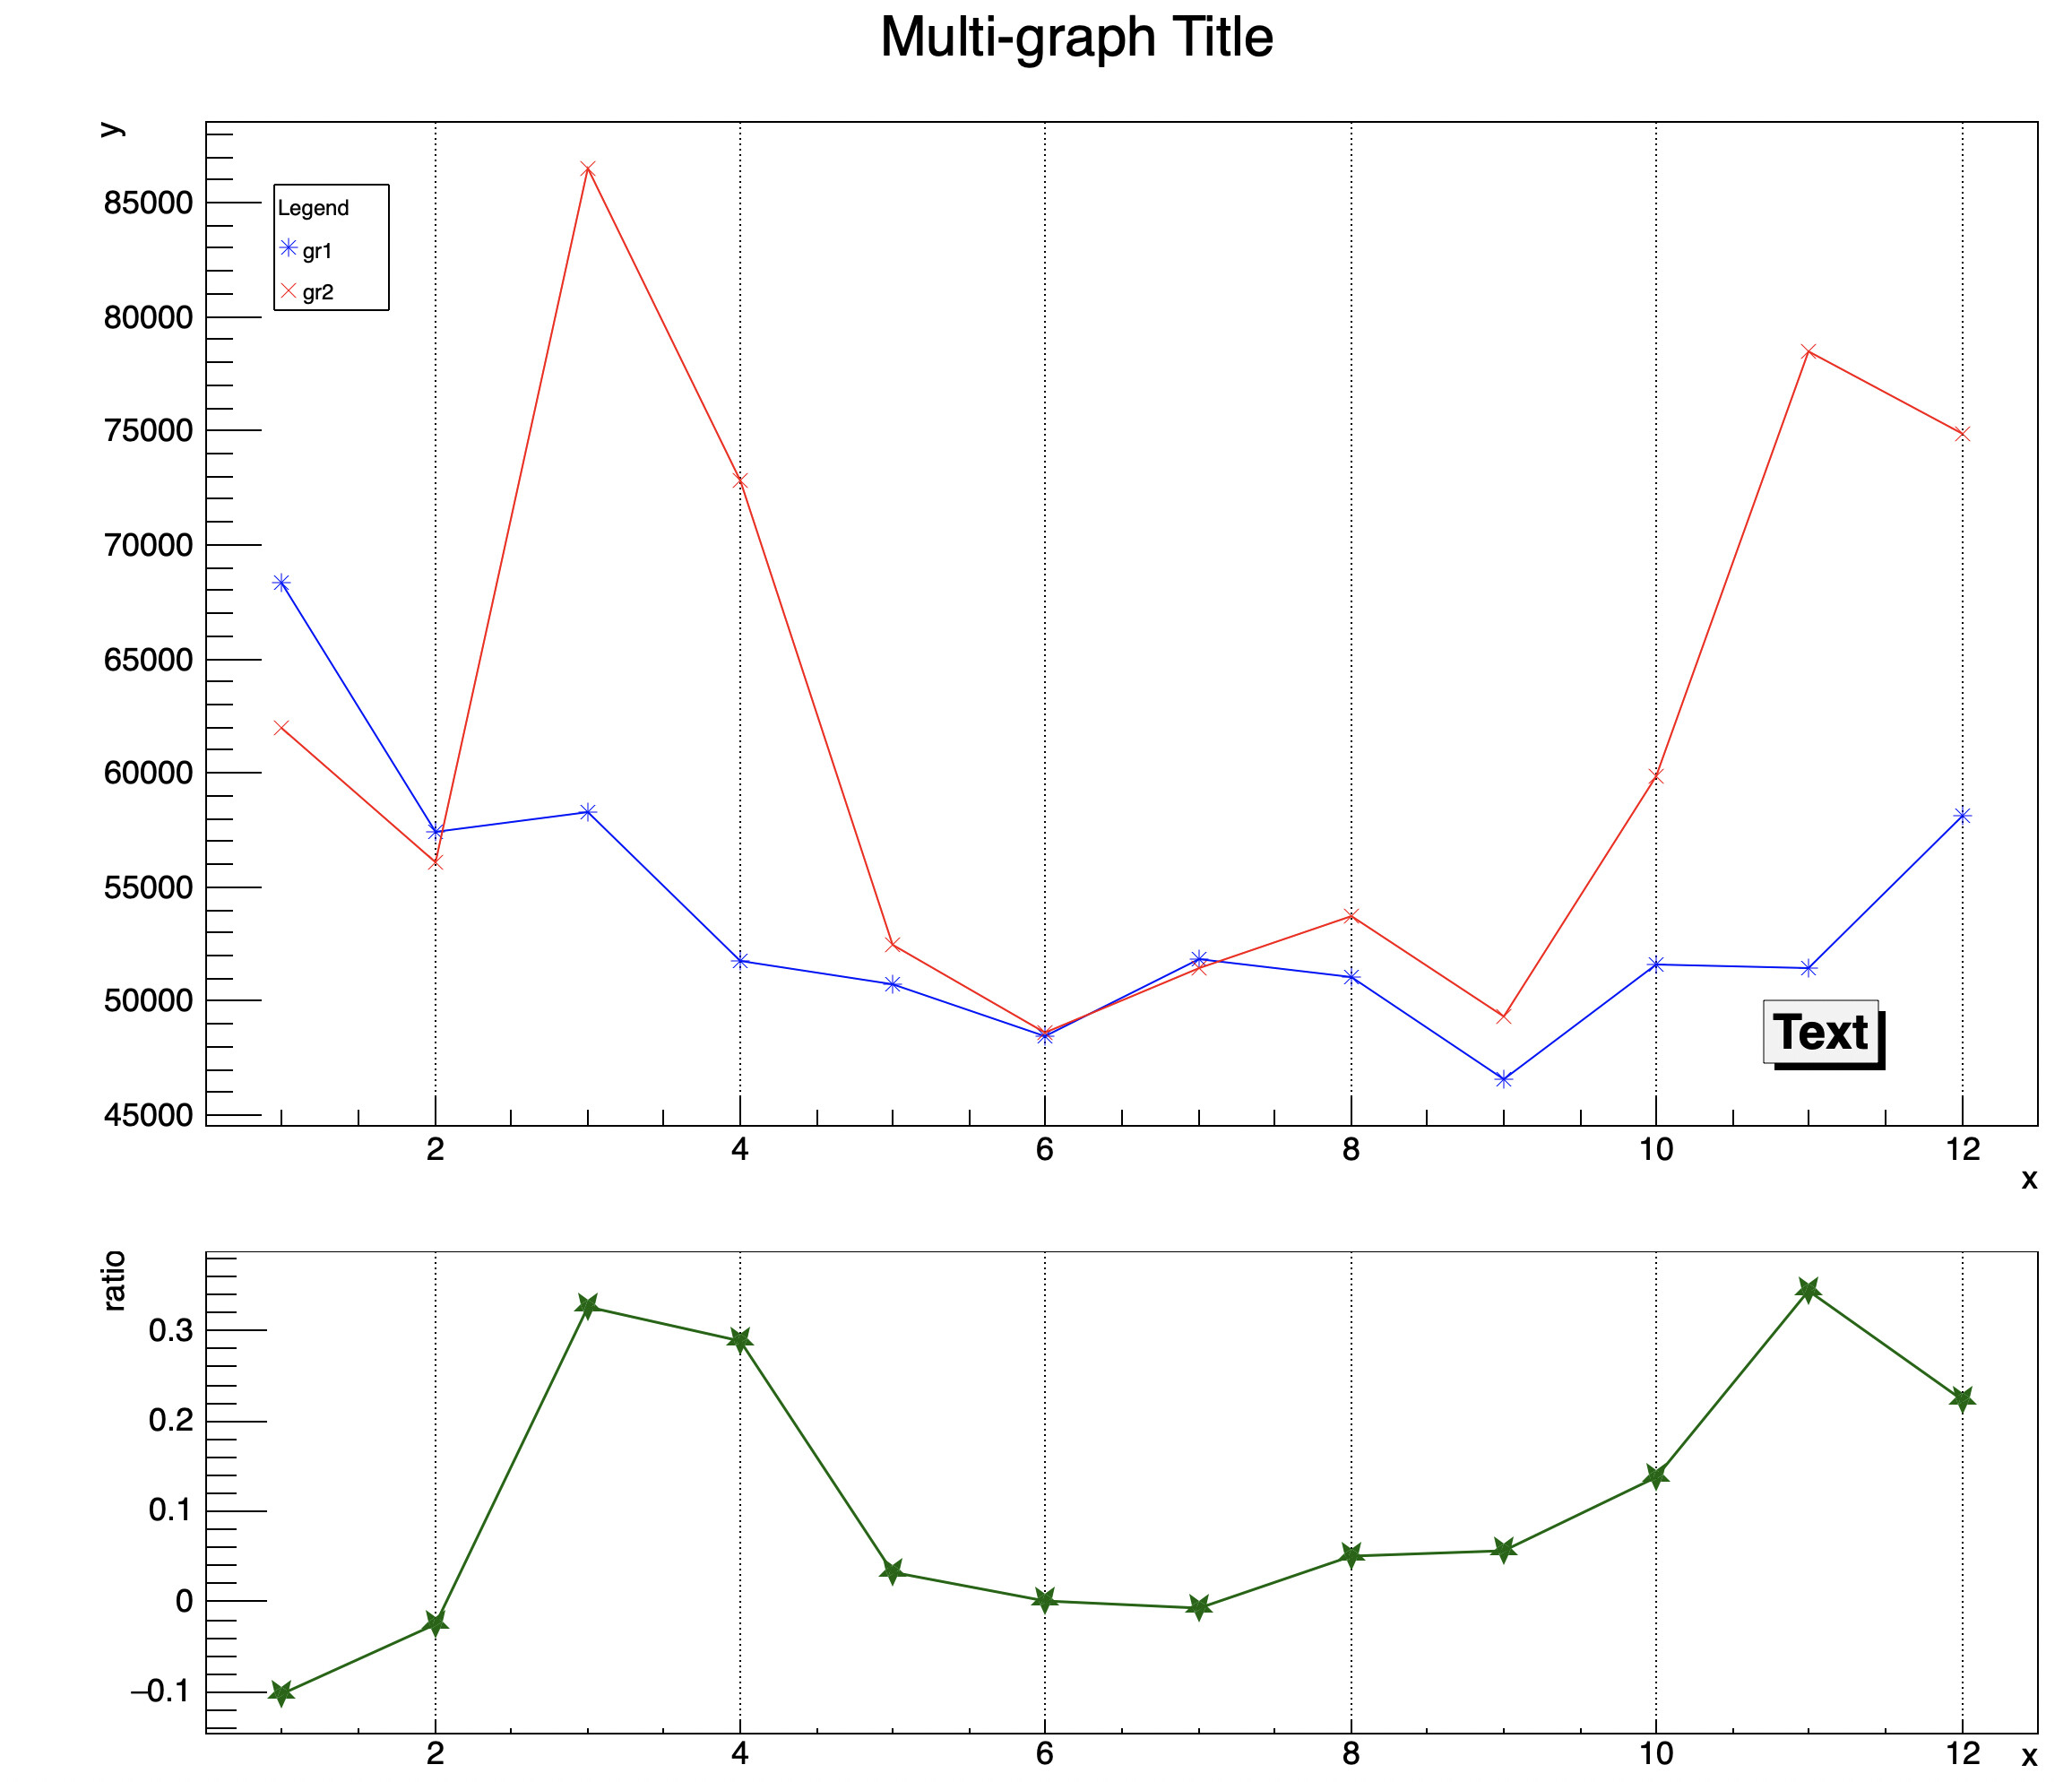
Now I need to add a second Cartesian plane under the first one to plot the difference between the 2 graphs…
on the top I’ve the plot of values and on the bottom I have a smaller plot for the difference then I added
auto rp1 = new TRatioPlot(gr1,gr2);
   rp1->Draw();
   rp1->GetLowerRefYaxis()->SetTitle("ratio");
   rp1->GetUpperRefYaxis()->SetTitle("Data");
but I get this error
C:\root_v6.22.08_master-build\include\TRatioPlot.h:158:4: note: candidate constructor not viable: requires 0 arguments, but 2 were provided
   TRatioPlot();
   ^
it says that I don’tha e to pass arguments to TRatioPlot but if i dont’ pass argument, what does it plot?
 auto rp1 = new TRatioPlot();
   rp1->Draw();
   rp1->GetLowerRefYaxis()->SetTitle("ratio");
   rp1->GetUpperRefYaxis()->SetTitle("entries");
the macro crashes
couet
April 20, 2021, 12:21pm
5
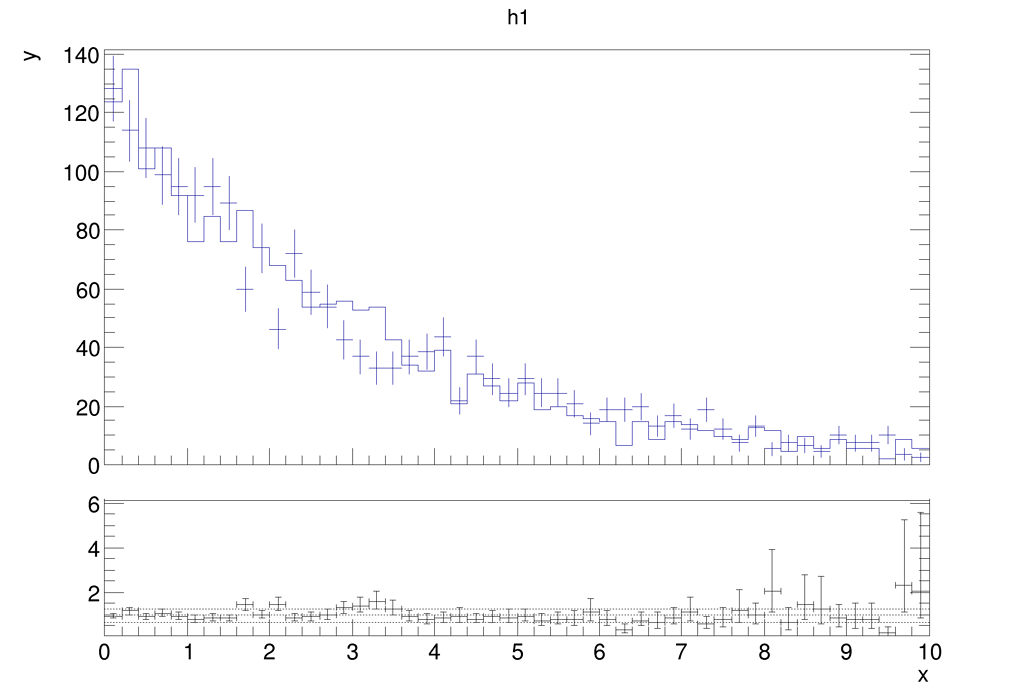
Look at the documentation , in particular the signature of the TRatioPlot constructors. None of them takes graphs. They you histograms .
faca87
April 20, 2021, 12:25pm
6
Thank you @couet and isn’t there something like TRatioPlot available for Tgraph?
couet
April 20, 2021, 12:27pm
7
No. I understand you want to have two pads. Just create the to pads at the right place and plot what you need in them.
faca87
April 20, 2021, 12:57pm
8
Hello @couet , so I calculated the difference (column 4)data.txt (328 Bytes)
and I added the code for the secondmulgr.cpp (2.8 KB) pad
but
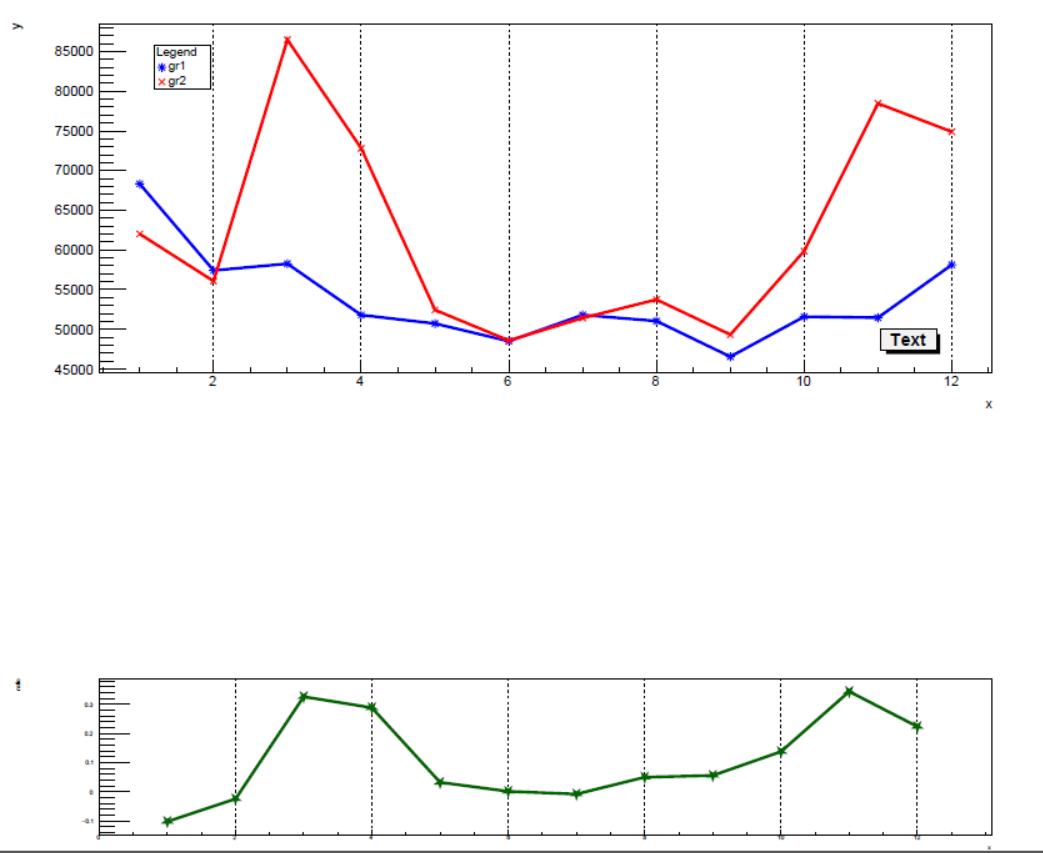
I don’t get the second pad
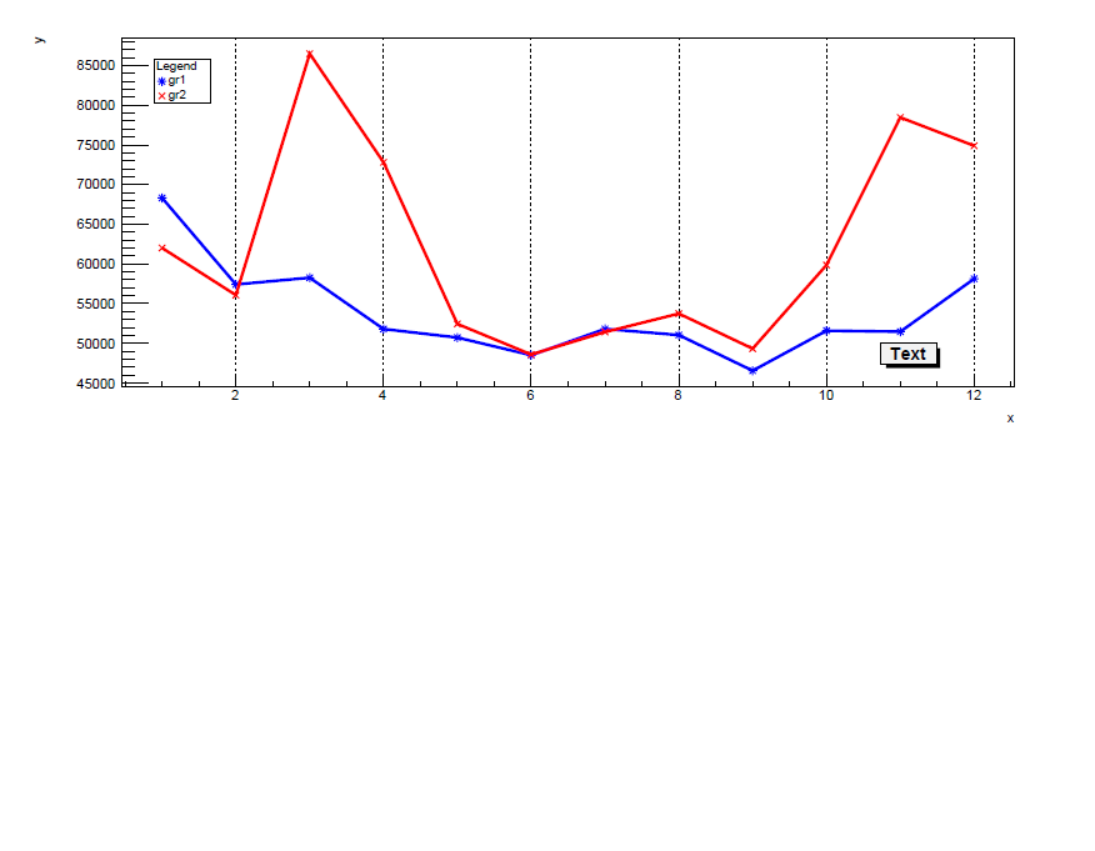
I don’t get the the graph title in the first pad
couet
April 20, 2021, 1:02pm
9
ratio->SetDrawOption("ALP");ratio->Draw("ALP");
faca87
April 20, 2021, 1:31pm
10
Thank you @couet ,
but please…last 2 questions:
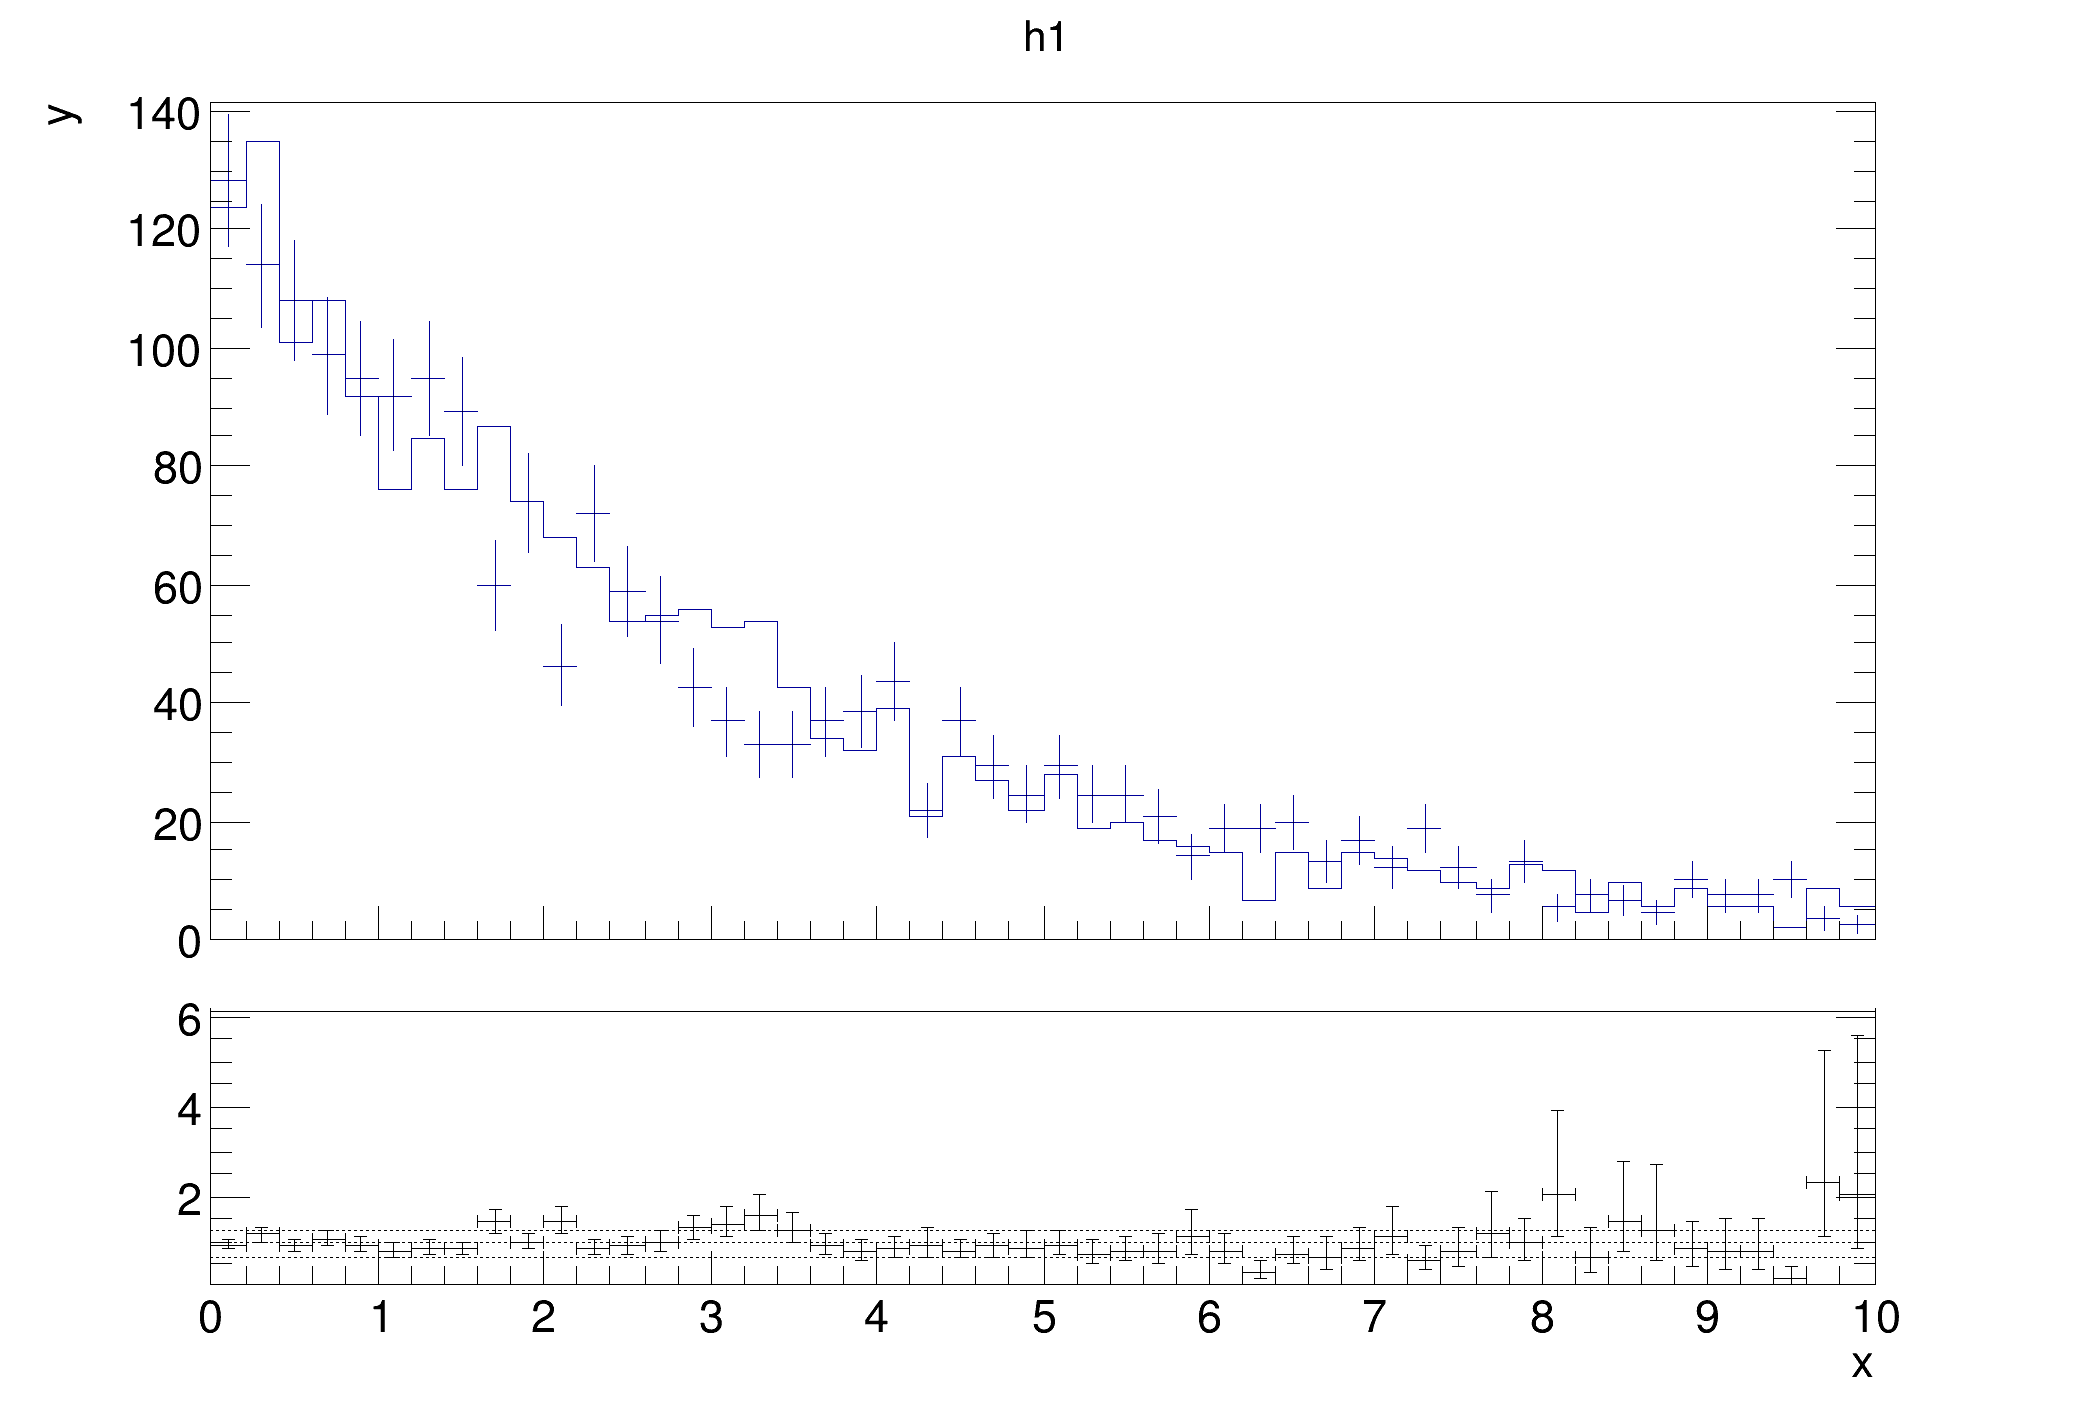
I would like to get the first pad higher than the second one as for example in this plot
If I replaceTPad *pad2 = new TPad("pad2", "pad2", 0.0, 0.0, 1., 0.5);TPad *pad2 = new TPad("pad2", "pad2", 0.0, 0.0, 1., 0.2);
So I would like to get the height of the first plot higher than the second one, but the space between them must not be so large
If I set the label title size, I don’t get the label titles
and if I set the label size the macro crashes!
here the update macromulgr.cpp (3.6 KB)
Thank you
couet
April 20, 2021, 2:37pm
11
#include "TCanvas.h"
#include "TPad.h"
#include "TMultiGraph.h"
#include "TGraph.h"
#include "TGraphErrors.h"
#include "TAxis.h"
#include "TLegend.h"
#include "TLatex.h"
#include "TROOT.h"
#include "TRatioPlot.h"
#include <cstdlib>

void mulgr() {

   gStyle->SetOptFit();
   const char *datain = "data.txt";
   const char *dataout = "plot.pdf";
   TCanvas *c01 = new TCanvas("c01","multigraph",1280,1024);
   TPad *pad1 = new TPad("pad1", "pad1", 0.0, 0.3, 1.0, 1.0);
   pad1->SetGridx();         // Vertical grid
   pad1->Draw();             // Draw the upper pad: pad1
   pad1->cd();
   TMultiGraph *mg = new TMultiGraph();
   mg->SetTitle("Multi-graph Title");
   float offx=1.3;
   float offy=1.3;
   float margr=0.08;
   float w=3;
   float margl=0.12;
   float line=2;
   gPad->SetLeftMargin(margl);
   gPad->SetRightMargin(margr);
   TPaveText *t=new TPaveText(0.8,0.15,0.85,0.2,"brNDC");
   TGraphErrors *gr1 = new TGraphErrors(datain,"%lg %lg %*lg %*lg");
   gr1->SetMarkerColor(kBlue);
   gr1->SetLineColor(kBlue);
   gr1->SetMarkerStyle(3);
   gr1->SetMarkerSize(1.3);
   gr1->SetLineWidth(line);
   gr1->SetDrawOption("AP");
   mg->Add(gr1);
   TGraphErrors *gr2 = new TGraphErrors(datain,"%lg %*lg %lg %*lg");
   gr2->SetMarkerColor(kRed);
   gr2->SetLineColor(kRed);
   gr2->SetMarkerStyle(5);
   gr2->SetMarkerSize(1.3);
   gr2->SetLineWidth(line);
   gr2->SetDrawOption("P");
   mg->Add(gr2);
   mg->Draw("ALP");
   c01->Modified();
   c01->Update();
   mg->GetXaxis()->SetTitle("x");
   mg->GetXaxis()->SetLimits(0.5,12.5);
   mg->GetYaxis()->SetTitle("y");
   mg->GetYaxis()->SetTitleOffset(offy);
   mg->GetXaxis()->SetTitleOffset(offx);
   mg->GetXaxis()->SetLabelFont(43);
   mg->GetXaxis()->SetLabelSize(20);
   mg->GetYaxis()->SetLabelFont(43);
   mg->GetYaxis()->SetLabelSize(20);
   mg->GetXaxis()->SetTitleFont(43);
   mg->GetXaxis()->SetTitleSize(20);
   mg->GetYaxis()->SetTitleFont(43);
   mg->GetYaxis()->SetTitleSize(20);
   c01->Modified();
   c01->Update();

   TLegend* leg = new TLegend(0.15, 0.75, .2, .85);
   leg->SetHeader("Legend");
   leg->SetNColumns(1);
   leg->AddEntry(gr1, "gr1", "AP");
   leg->AddEntry(gr2, "gr2", "P");
   leg->Draw();

   gPad->Update();
   t->AddText("Text");
   t->Draw();
   c01->cd();
   c01->Update();
   TPad *pad2 = new TPad("pad2", "pad2", 0.0, 0.0, 1.0, 0.3);
   pad2->SetTopMargin(0.0);
   pad2->SetGridx(); // vertical grid
   pad2->Draw();
   pad2->cd();       // pad2 becomes the current pad
   gPad->SetLeftMargin(margl);
   gPad->SetRightMargin(margr);
   TGraphErrors *ratio = new TGraphErrors(datain,"%lg %*lg %*lg %lg");
   ratio->SetTitle(" ");
   ratio->SetMarkerColor(kGreen+3);
   ratio->SetLineColor(kGreen+3);
   ratio->SetLineWidth(3);
   ratio->SetMarkerSize(2);
   ratio->SetMarkerStyle(29);
   ratio->Draw("ALP");
   ratio->GetXaxis()->SetLimits(0.5,12.5);
   ratio->GetXaxis()->SetLabelFont(43);
   ratio->GetXaxis()->SetLabelSize(20);
   ratio->GetYaxis()->SetLabelFont(43);
   ratio->GetYaxis()->SetLabelSize(20);
   ratio->GetXaxis()->SetTitleFont(43);
   ratio->GetXaxis()->SetTitleSize(20);
   ratio->GetYaxis()->SetTitleFont(43);
   ratio->GetYaxis()->SetTitleSize(20);
   ratio->GetXaxis()->SetTitle("x");
   ratio->GetYaxis()->SetTitle("ratio");
   ratio->GetYaxis()->SetTitleOffset(offy);
   ratio->GetXaxis()->SetTitleOffset(offx);
   c01->Modified();
   c01->Update();
   c01->Print(dataout);
}
faca87
April 20, 2021, 4:20pm
13
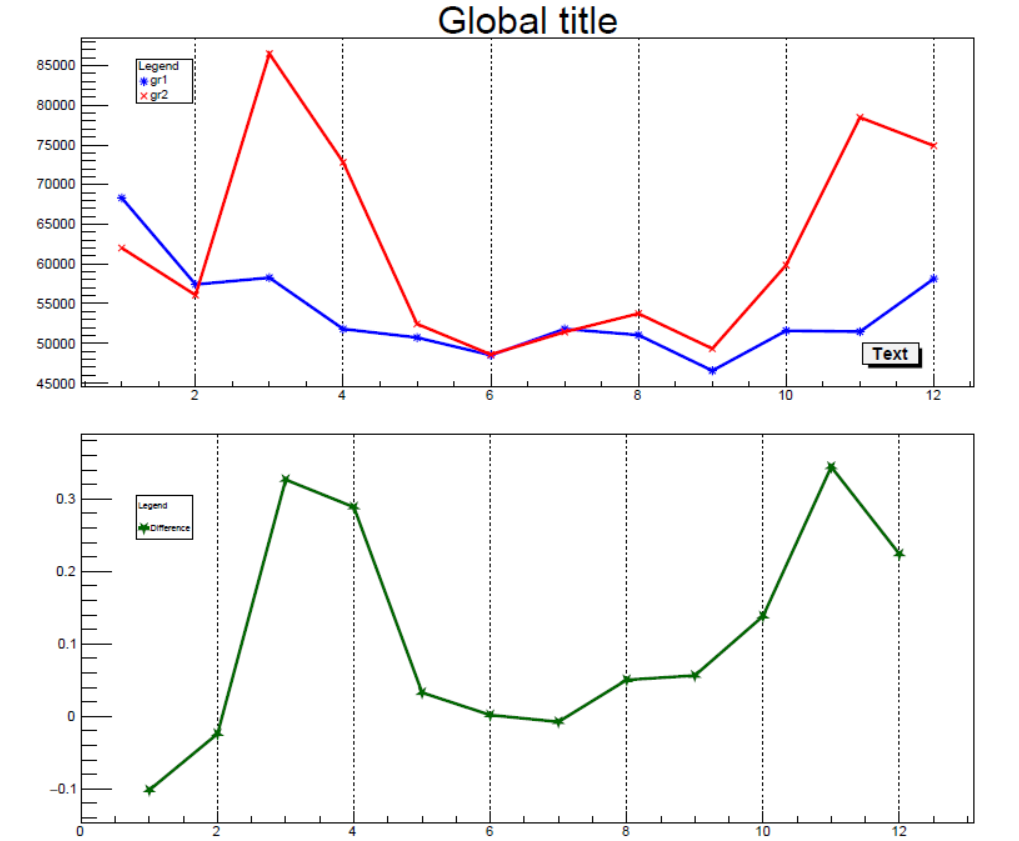
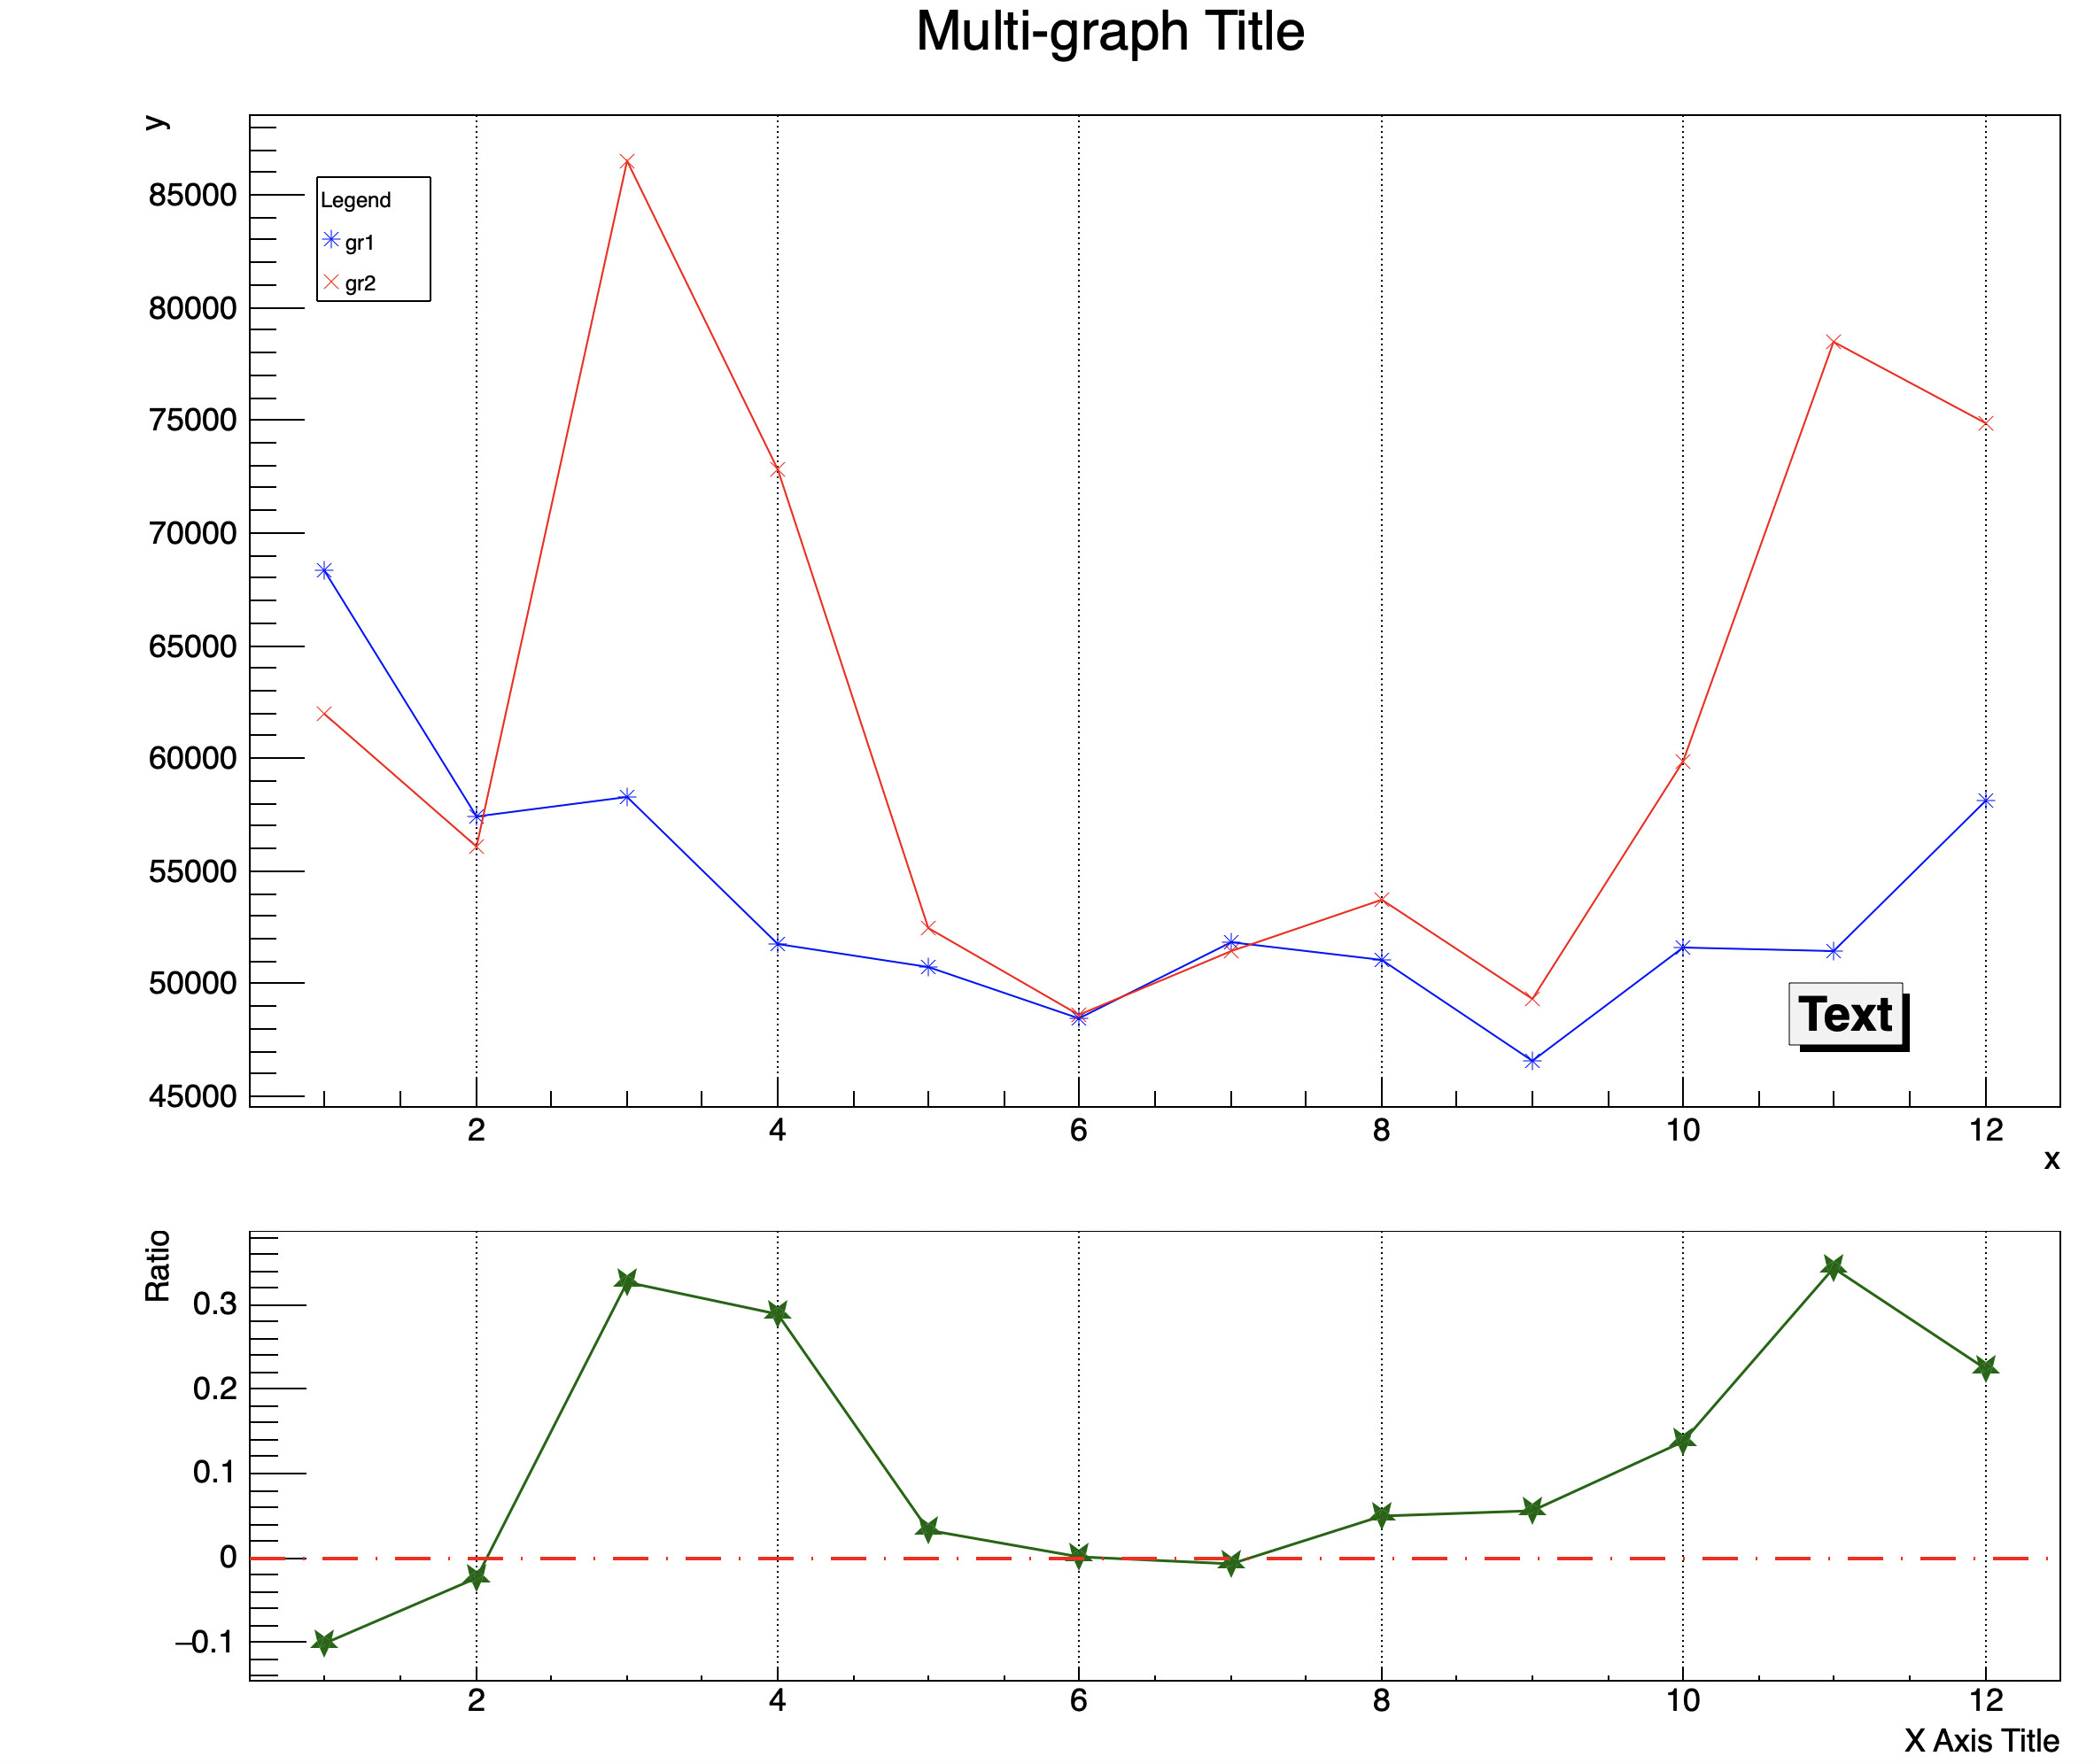
Sorry @couet I noticed 2 problems
gStyle->SetTitleSize(0.05);
!
``pad2->SetBottomMargin(3);`
doesn’t work
void DrawVerticalLine(Double_t x)
{
   TLine l;
   Double_t lm = gPad->GetLeftMargin();
   Double_t rm = 1.-gPad->GetRightMargin();
   Double_t tm = 1.-gPad->GetTopMargin();
   Double_t bm = gPad->GetBottomMargin();
   Double_t xndc = (rm-lm)*((x-gPad->GetUxmin())/(gPad->GetUxmax()-gPad->GetUxmin()))+lm;
   l.DrawLineNDC(xndc,bm,xndc,tm);
}
float threshold = 0;
			auto lnThreshold = new TLine(0, threshold, gPad->GetUxmax(),threshold);
			lnThreshold->SetLineColor(kRed);
			lnThreshold->SetLineStyle(10);
			lnThreshold->SetLineWidth(2.);  // maybe
			lnThreshold->Draw();
			//DrawVerticalLine(2.);
            gPad->Modified();
that I use to draw a line on 0 in the second pad (I used this code in other plots) but in this case the line starts out of the the plot
Thanks
couet
April 20, 2021, 6:03pm
14
#include "TCanvas.h"
#include "TPad.h"
#include "TMultiGraph.h"
#include "TGraph.h"
#include "TGraphErrors.h"
#include "TAxis.h"
#include "TLegend.h"
#include "TLatex.h"
#include "TROOT.h"
#include "TRatioPlot.h"
#include <cstdlib>

void mulgr() {

   gStyle->SetOptFit();
   const char *datain = "data.txt";
   const char *dataout = "plot.pdf";
   TCanvas *c01 = new TCanvas("c01","multigraph",1280,1024);
   TPad *pad1 = new TPad("pad1", "pad1", 0.0, 0.3, 1.0, 1.0);
   pad1->SetGridx();         // Vertical grid
   pad1->Draw();             // Draw the upper pad: pad1
   pad1->cd();
   gStyle->SetTitleFontSize(0.05);
   TMultiGraph *mg = new TMultiGraph();
   mg->SetTitle("Multi-graph Title");
   float offx=1.3;
   float offy=1.3;
   float margr=0.08;
   float w=3;
   float margl=0.12;
   float line=2;
   float xl1 = 0.5, xl2 = 12.5;
   gPad->SetLeftMargin(margl);
   gPad->SetRightMargin(margr);
   TPaveText *t=new TPaveText(0.8,0.15,0.85,0.2,"brNDC");
   TGraphErrors *gr1 = new TGraphErrors(datain,"%lg %lg %*lg %*lg");
   gr1->SetMarkerColor(kBlue);
   gr1->SetLineColor(kBlue);
   gr1->SetMarkerStyle(3);
   gr1->SetMarkerSize(1.3);
   gr1->SetLineWidth(line);
   gr1->SetDrawOption("AP");
   mg->Add(gr1);
   TGraphErrors *gr2 = new TGraphErrors(datain,"%lg %*lg %lg %*lg");
   gr2->SetMarkerColor(kRed);
   gr2->SetLineColor(kRed);
   gr2->SetMarkerStyle(5);
   gr2->SetMarkerSize(1.3);
   gr2->SetLineWidth(line);
   gr2->SetDrawOption("P");
   mg->Add(gr2);
   mg->Draw("ALP");
   c01->Modified();
   c01->Update();
   mg->GetXaxis()->SetTitle("x");
   mg->GetXaxis()->SetLimits(xl1,xl2);
   mg->GetYaxis()->SetTitle("y");
   mg->GetYaxis()->SetTitleOffset(offy);
   mg->GetXaxis()->SetTitleOffset(offx);
   mg->GetXaxis()->SetLabelFont(43);
   mg->GetXaxis()->SetLabelSize(20);
   mg->GetYaxis()->SetLabelFont(43);
   mg->GetYaxis()->SetLabelSize(20);
   mg->GetXaxis()->SetTitleFont(43);
   mg->GetXaxis()->SetTitleSize(20);
   mg->GetYaxis()->SetTitleFont(43);
   mg->GetYaxis()->SetTitleSize(20);
   c01->Modified();
   c01->Update();

   TLegend* leg = new TLegend(0.15, 0.75, .2, .85);
   leg->SetHeader("Legend");
   leg->SetNColumns(1);
   leg->AddEntry(gr1, "gr1", "AP");
   leg->AddEntry(gr2, "gr2", "P");
   leg->Draw();

   gPad->Update();
   t->AddText("Text");
   t->Draw();
   c01->cd();
   c01->Update();
   TPad *pad2 = new TPad("pad2", "pad2", 0.0, 0.0, 1.0, 0.3);
   pad2->SetTopMargin(0.0);
   pad2->SetGridx(); // vertical grid
   pad2->Draw();
   pad2->cd();       // pad2 becomes the current pad
   gPad->SetLeftMargin(margl);
   gPad->SetRightMargin(margr);
   gPad->SetBottomMargin(0.15);

   TGraphErrors *ratio = new TGraphErrors(datain,"%lg %*lg %*lg %lg");
   ratio->SetTitle(" ");
   ratio->SetMarkerColor(kGreen+3);
   ratio->SetLineColor(kGreen+3);
   ratio->SetLineWidth(3);
   ratio->SetMarkerSize(2);
   ratio->SetMarkerStyle(29);
   ratio->Draw("ALP");
   ratio->GetXaxis()->SetLimits(xl1,xl2);
   ratio->GetXaxis()->SetLabelFont(43);
   ratio->GetXaxis()->SetLabelSize(20);
   ratio->GetYaxis()->SetLabelFont(43);
   ratio->GetYaxis()->SetLabelSize(20);
   ratio->GetXaxis()->SetTitleFont(43);
   ratio->GetXaxis()->SetTitleSize(20);
   ratio->GetYaxis()->SetTitleFont(43);
   ratio->GetYaxis()->SetTitleSize(20);
   ratio->GetXaxis()->SetTitle("X Axis Title");
   ratio->GetXaxis()->SetTitleOffset(3.5);
   ratio->GetYaxis()->SetTitle("Ratio");
   ratio->GetYaxis()->SetTitleOffset(offy);

   float threshold = 0;
   auto lnThreshold = new TLine(xl1, threshold, xl2 ,threshold);
   lnThreshold->SetLineColor(kRed);
   lnThreshold->SetLineStyle(10);
   lnThreshold->SetLineWidth(2.);  // maybe
   lnThreshold->Draw();

   c01->Modified();
   c01->Update();
   c01->Print(dataout);
}
faca87
April 20, 2021, 7:05pm
15
Thank you for all the help @couet !