After I recently update to ROOT 6.16, some of my scripts dealing with 2D histograms drawn with the “colz” option started to behave differently.
Previously, I had ROOT 6.08, and plotting multiple 2D histograms with different color maps and different ranges in the same pad was possible thanks to the TExec trick (e.g. see this post)
Each one of the histos had their independent color scale which could be set with an independent range.
Now, all the histograms after the first one drawn use the range of the first.
However this is inconsistent in my opinion because the color scale does not correspond with what is shown.
Please, consider this python script: testPalettes.py (2.9 KB)
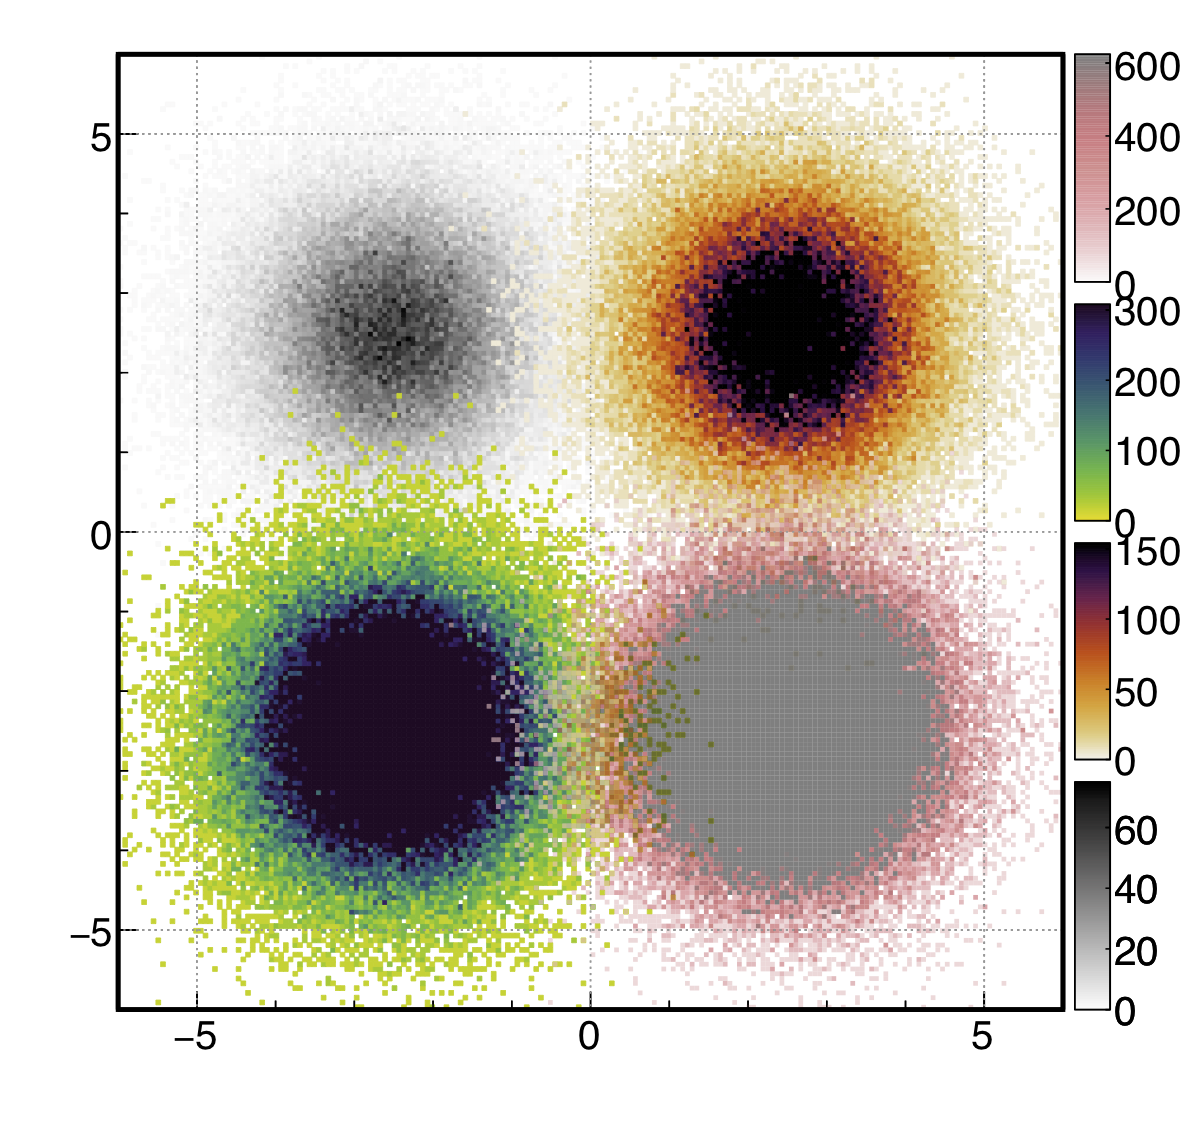
It plots 4 gaussian distributions with the same number of entries but a different weight:
The relative weight between the four histograms is 1, 2, 4 and 8, respectively.
Although the color maps are displayed correctly (at the right margin of the canvas), the distributions are shown only within the range of the first drawn histogram.
This behaviour is inconsistent, as the colors shown in the histograms do not correspond with the values indicated in the color maps (it only matches for the first histogram drawn).
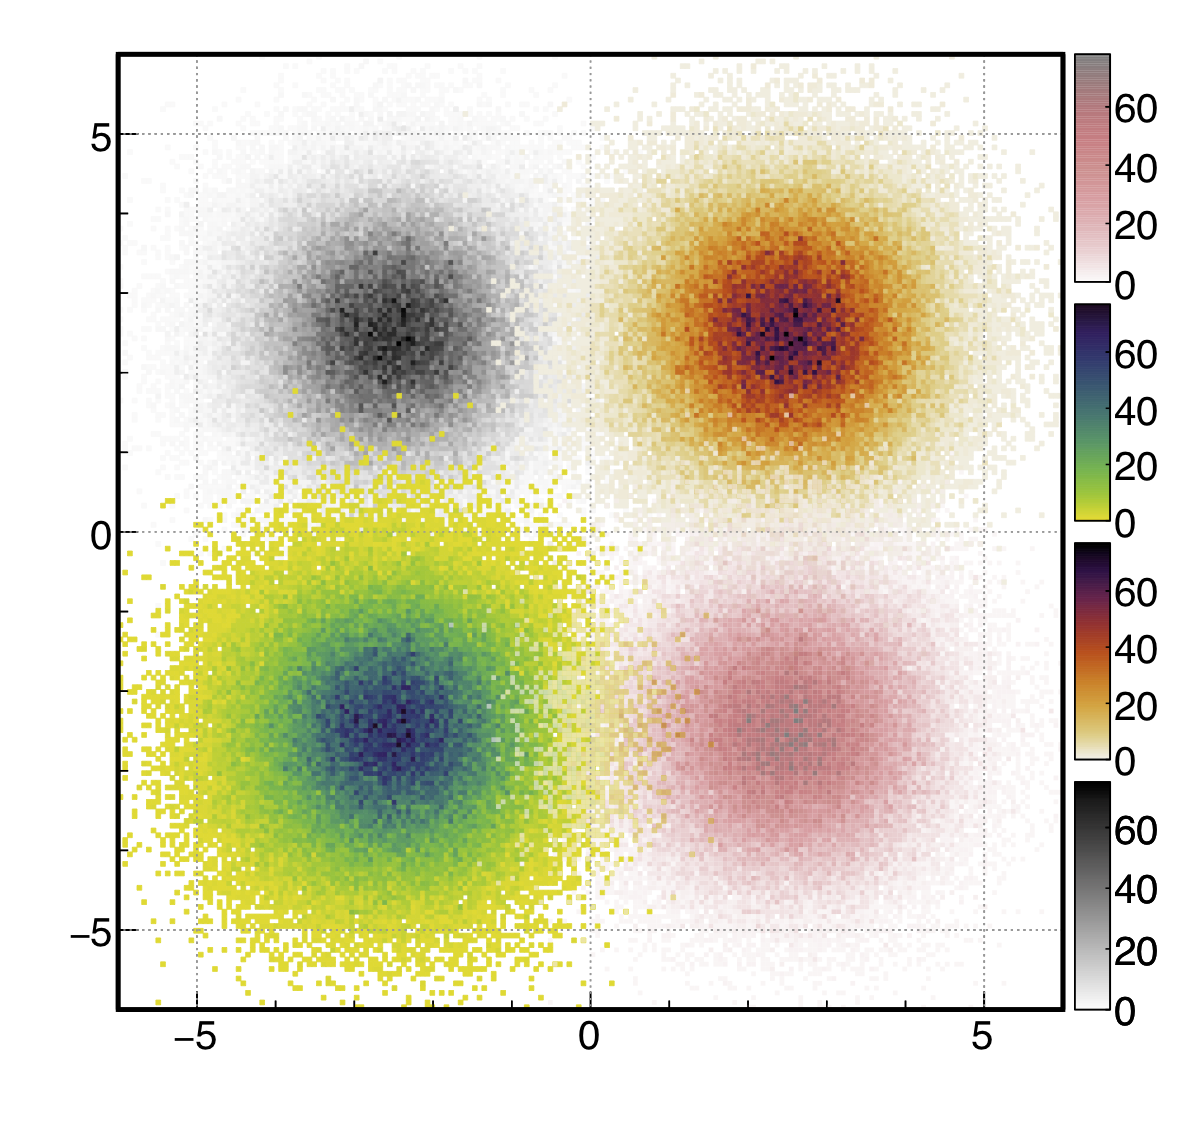
By default, each of the histograms should be shown within their own independent range if “colz” is used.
I understand that when only one color map is used, or in case that one use just the “col” option,
this could be the default behaviour, but not when independent palettes are used and printed in the pad.
I have seen that in root 6.17 one can set back the good old default behaviour by using the “SAME0” option.
Can I ask why the default behaviour was changed?
I think that it made more sense before. Also, by needing to introduce a new flag, one loses backwards compatibility with already existing code.
Hello Oliver,
Yes, I saw that, but still think that this should not be the default behavior.
The first Figure that I posted in this thread clearly shows that there is something inconsistent (wrong).
The option SAME with COL is consistent with the option SAME with BOX .
So seems to me it is very consistent !
The plot you are doing are very nice but quite complex already as they you the TExec trick. Several palettes in a single pad is also not very common. So the general case is the new behaviour (since 6.9). If you do not want the cut along Z you can add code setting the same maximum for also histograms. (SetMaximum())
Alright, I guess you have your reasons to have changed the default behavior of “colz”.
I won’t insist here, although I still consider inconsistent to draw a color map whose values do not correspond to what is shown in the histogram.
Being practical: what can I do to plot several distributions with different color maps (and different ranges) in the same pad? (I use this feature all the time).
The option “SAME0” is not yet implemented in my current version of ROOT.
I would like to have different ranges for each histogram.
Imagine that some of these distributions have a much lower density scale than the rest.
It would be barely visible if I use the same max…