Multi-page PDF Graphics

Hi,
How can I create a PDF file with many pages of graphics in it ? For example, if I have a macro that generates hundreds of different pages of graphics, how can put them all into one single PDF file, rather than creating a separate PDF file for each graphic ?

 Thanks.

-Arun

{
   TFile f("hsimple.root","READ");
   c1 = new TCanvas("c1","sub data",200,10,700,500);

   hpx->Draw(); c1->Print("h1.pdf(","pdf");
   hpx->Draw(); c1->Print("h1.pdf","pdf");
   hpx->Draw(); c1->Print("h1.pdf)","pdf");
}
1 Like

It works great. Thanks a lot.
-Arun

Hi

I found this post useful But I have one problems. I am running pyroot (root 6.02 on Mavericks )

  1. I am producing many canvases (>100). If I save them individually as .png or .pdf files, they seem all right.
    However, when I try to save them all in one single PDF file, some labels disapear :frowning: Have a look to the attachments please.

  2. I tried to save them all in one png file with many pages, but the recippee doesn’t work. It says:
    Error in TASImage::WriteImage: cannot determine a valid file type
    (that comes from: Canvases[i].Print(“myfile.png[”,“png”) )

Is there a way to make all the labels to be stored in the many-pages pdf ? Is there a way to create a many pages png or tiff ?

Thanks in advance for your help
Salva
PlotsOfHits.pdf (196 KB)
nSCTHits.pdf (17 KB)


  1. have you tried a more recent version?

  2. by construction png files (and in general binary images) have only one image per file.

Hi

well… I just tried with 6.04 and 6.06. Unfortunatelly it doesn’t work now. This is the error I obtain:

maxYVal = 83384.8828125 , minYVal = 0.0
going to save file … as /Users/martis/projectes/atlas/alineament/webmonitoringtest/InDetAlignmentWebMonitor/trunk/WebPage/detailed_plots/2016//nPIXHits.pdf

*** Break *** segmentation violation
Traceback (most recent call last):
File “MakeMajorAlignMonPlots.py”, line 209, in
if (doHits): execfile(“MakeHitPlots.py”)
File “MakeHitPlots.py”, line 29, in
canvasText,makeOutput)
File “/Users/martis/projectes/atlas/alineament/webmonitoringtest/InDetAlignmentWebMonitor/trunk/database/Monitor/utilities.py”, line 514, in DrawPlots
can.SaveAs(outputName)
SystemError: void TPad::SaveAs(const char* filename = “”, const char* option = “”) =>
problem in C++; program state has been reset

No idea why this happens.

Cheers
Salva

can you post a small script reproducing the problem ?

Hi

unfortunatelly, my script is to big (actually it is a set of scripts calling each other) that reads many histogram files and plot them on top of the other.

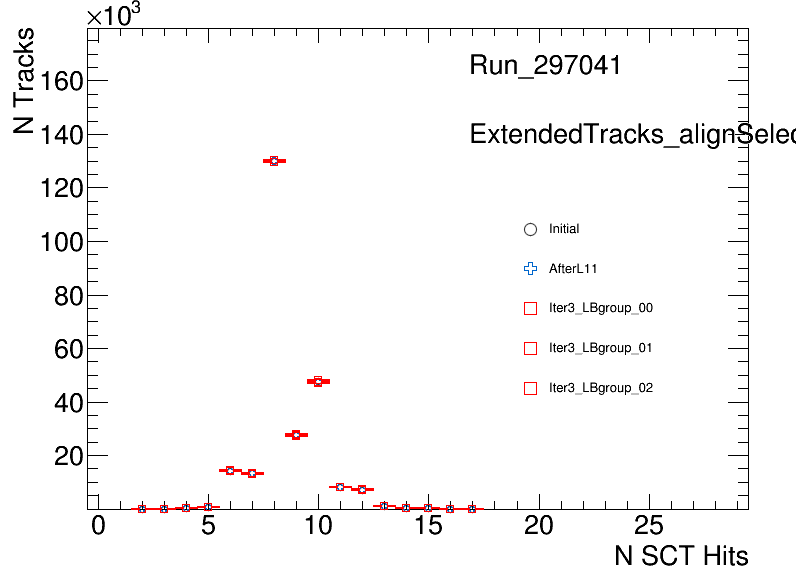
I wrote a simple python script which does the same in a simplified way, and it almost works (no crash), only I was expecting to see only markers for the histograms, and there is one histogram that is drawn with a solid line. No idea why. If you may have a look :wink:

Comming back to the crash I have with 6.04 and 6.06, as said it is hard to debug as I create many canvases. They are properly saved until it crashes after saving an arbitrary number of canvases. It is quite reproducible. I mean, If I try to create 50 canvases, it works well, up to canvas number 30 something, then it crashes. If I retry, it crashes again exactly on the same, not in a different one.

This is the bit of code that crashes:
print " going to save file … as ", outputName

if makeOutput:
    print " can --> ", can
    can.Print()
    can.SaveAs(outputName)
    print " <DrawPlots> file ", outputName, " succesfuly stored "

This is the output when crashes:
going to save file … as /Users/martis/projectes/atlas/alineament/webmonitoringtest/InDetAlignmentWebMonitor/trunk/WebPage/detailed_plots/2016//nPIXHits.png
can --> <ROOT.TCanvas object ("/Users/martis/projectes/atlas/alineament/webmonitoringtest/InDetAlignmentWebMonitor/trunk/WebPage/detailed_plots/2016//nPIXHits.png") at 0x7fed2215c5b0>

*** Break *** segmentation violation
Traceback (most recent call last):
File “MakeMajorAlignMonPlots.py”, line 209, in
if (doHits): execfile(“MakeHitPlots.py”)
File “MakeHitPlots.py”, line 29, in
canvasText,makeOutput)
File “/Users/martis/projectes/atlas/alineament/webmonitoringtest/InDetAlignmentWebMonitor/trunk/database/Monitor/utilities.py”, line 515, in DrawPlots
can.Print()
TypeError: none of the 2 overloaded methods succeeded. Full details:
void TPad::Print(const char* filename = “”) =>
problem in C++; program state has been reset
void TPad::Print(const char* filename, const char* option) =>
takes at least 2 arguments (0 given)

Cheers
Salva
mytest.py (1.62 KB)

In your script, you are saving the canvas at the end of the macro.
That’s not the way multipage pdf is working.
See an example here:
root.cern.ch/doc/master/classTPDF.html