Hi!
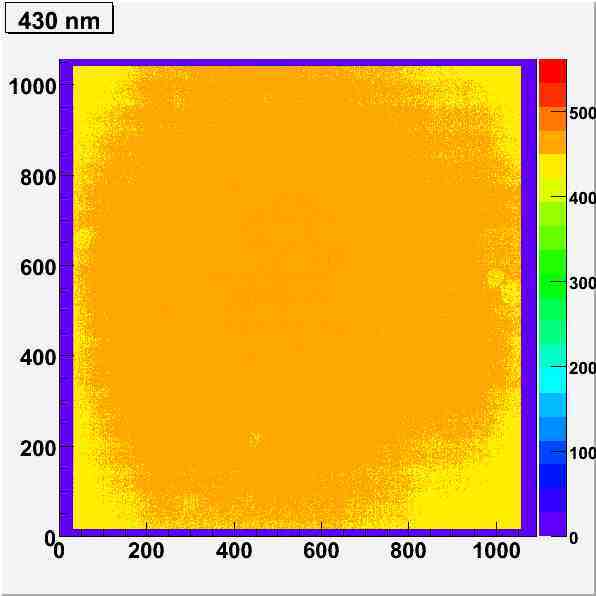
I often have the problem that the colour axis in colz or contz plots is just too much to the right and b/c of that loosing figures of the labels of the z-axis. (see attached image, created insided an embedded canvas, the range is actually 5000).
Even in the FirstContour tutorial one can see, that the only reason all numbers are displayed is the low range of the colour axis.
So I wonder: Is there a programmable way of making more space for the colour column so that i don’t have to reduce the label size so much that it becomes hard to read?
Thanks for any hint!
Best regards,
Michael
PS: using CVS version (updated today) on Linux (Kubuntu)
Change the pad right margin size:
pad->SetRightMargin();
Note that a good way to learn how to change the pad layout is to modify the pad interactivaly using the mouse and then save the result as a .C file from the “File” menu entry. In the saved file you will see how to do by program what you just did interactively.
Simply call
gPad->SetRightMargin(margin);
with margin = 0.2 (default is 0.1)
Rene
With shame  I realised that my question is actually answered even in the manual.
Ash on my head and I promise to have a look there first from now on. 
Thanks for your answers and tips,
Michael