Hi experts,
I am running Classification (BDT) with one BSM signal and multiple backgrounds. I wanted to know if it’s possible to use any other significance formula to optimize the method. I saw this post to use Asimov significance. But I wanted to use the formula S/sqrt(B) and preferably with systematic uncertainty. Is it anyhow possible to do that? I saw the file mvaeffs.cxx in root_source/tmva/tmvagui/src/ . Is it possible to change something in this file re-build root to achieve that?
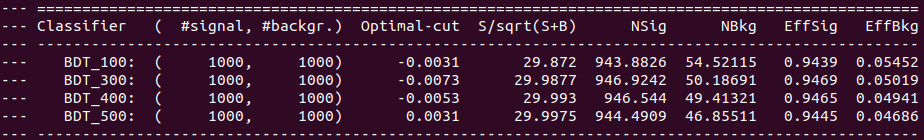
Also I noticed (while running the macro) in the terminal output a bit peculiar behaviour. For the default plots (S=1000=B) the table is
Is this behaviour consistent? Because, I was expecting that the efficiencies would be same just the event numbers would be rescaled and thus different significance would be evaluated.
Any help with this will be appreciated.
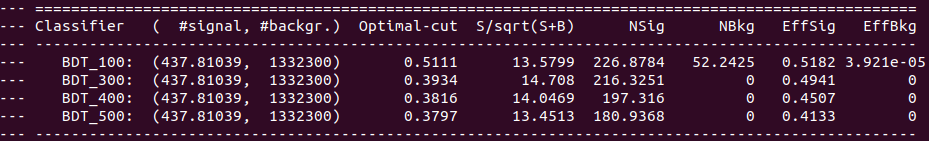
It is normal the results are different changing the number of events, because what it shows is the efficiency at the optimal cut value (i.e. maximising the significance).
For changing the formula for the significance from the default S/Sqrt(S+B), you can pass a different formula as a string in the mvaeff function (see line 531 of mvaeffs.cxx ).
Thanks a lot, @moneta for the reply. And sorry for my late response.
The first issue with the significance metric is okay, I could use different formulas; although it doesn’t get included in the GUI (for that, I suppose one has to modify the file root_source/tmva/tmva/src/SdivSqrtSplusB.cxx and not advised).
But I was trying to understand your comment on the 2nd issue:
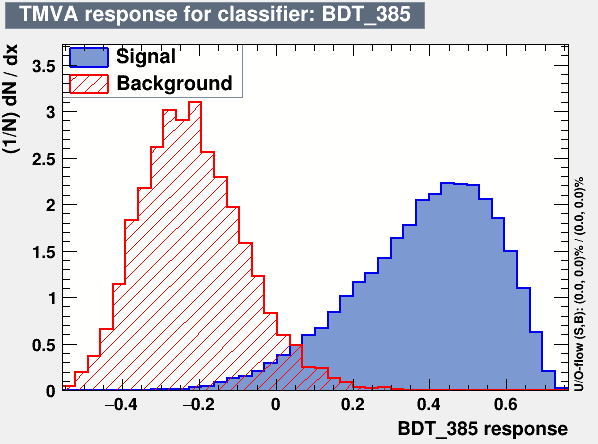
I suppose you were mentioning the following plot,
This plot is generated for the default number of events (1000) for S and B. And the optimized cut is around 0.05. But with the modified (actual) number of events with large background and tiny signal, the optimized point to cut moves towards the right where eventually backgrounds vanish to optimize the significance. Am I understanding it correctly? If this is the case what do you suggest to fix this? Would larger statistics of background be better; I tried playing with the parameters of the method but didn’t work?
Also, is there a way to get the modified MVA output plot for the modified number of events?
Yes this is correct!
To get a more precise value for the optimal point it would be good to have more statistics for the background, but you should use the actual number of events that you expect in your real data sample in order to find the optimal point.
I think the output plot has as number of events the one used for the training. Maybe you can try setting an overall weight for the input signal and background trees reflecting the actual numbers you will have in your data and that you will use to optimise your analysis.
Thanks a lot, @moneta.
Yes, I am waiting for the larger dataset, and then I would update you. And yes I am using the real data sample I expect and then only the background events after cut becoming zero. With the default numbers, it’s still okay.
Yes, I am giving the events weights (CS*Lumi/gen_evt), this is correct, right or should I give instead of ‘gen_evt’, number of events in the trees? But here’s the question I was waiting to ask; how is this weight participating in the analysis. Because in the mva output plots as well as the significance plots, it seems that it’s not considering the weight factors (although it does of course).