Memory leak during repeated fitting. See macro.
ROOT Version: 6.28/10
Platform: Ubuntu 20.04
example_fit.cpp (3.1 KB)
Memory leak during repeated fitting. See macro.
ROOT Version: 6.28/10
Platform: Ubuntu 20.04
example_fit.cpp (3.1 KB)
Welcome to the ROOT forum.
I think your post is missing the “macros”.
example_fit.cpp (3.1 KB)
Attached
Processing example_fit.cpp...
In file included from input_line_9:1:
/Users/couet/Downloads/example_fit.cpp:33:10: fatal error: 'MpdADC64ECalDigit.h' file not found
#include "MpdADC64ECalDigit.h"
         ^~~~~~~~~~~~~~~~~~~~~
This library is not needed for this example and it can be safely commented out or deleted.
I ran you macro several times in the same ROOT session. Each time I execute it I see the memory size used by root.exe increasing by 2 MB. is that what you see also ?
Yes that’s what I mean
I see it also increasing with this simple one:
void FitOscillograms()
{
    vector<Double_t> data {12, 0, 15, -2, 6, -2, 6, 0, -14, -11, 22, -3, 21, 3, -22, -651, -2131, -3031, -3323, -2923, -2579, -2267, -1899, -1603, -1299, -1075, -875, -719, -563, -459, -347, -299, -219, -195, -147, -143, -103, -91, -48, -50, -23, -10, 3, 2, 16, 10, 32, 14, 17, -10, 6, -3, 4, 3, 17, 8, 7, -1, 13, 3};

    for (int j = 0; j < 60000 ; j++)
    {
        Double_t MaxDelta = 3323;
        Double_t BinMax = 19;
    }
}

void example_fit()
{
    FitOscillograms();
}
It is clear how to deal with this.
Here are two different codes:
graph->Fit()… - there is a memory leak
void FitOscillograms()
{
vector<Double_t> data {12, 0, 15, -2, 6, -2, 6, 0, -14, -11, 22, -3, 21, 3, -22, -651, -2131, -3031, -3323, -2923, -2579, -2267, -1899, -1603, -1299, -1075, -875, -719, -563, -459, -347, -299, -219, -195, -147, -143, -103, -91, -48, -50, -23, -10, 3, 2, 16, 10, 32, 14, 17, -10, 6, -3, 4, 3, 17, 8, 7, -1, 13, 3};
Double_t MaxDelta = 3323;
Double_t BinMax = 19;
TGraphErrors* graph = new TGraphErrors(60);
for(int i = 0; i < 60; i++)
{
graph->SetPoint (i, i, 0 - data[i]);
graph->SetPointError(i, 0, 5);
}
TF1* pFit = new TF1(“Novosibirsk”, Novosibirsk, 0., 60, 4);
pFit->SetParameters(MaxDelta, 0.05, 8., BinMax);
for (int j = 0; j < 60000000 ; j++)
{
if(j%10 == 0) {
cout << "\nCount# " << j << endl;
}
 /*TFitResultPtr r = */ graph->Fit(pFit, "QR0", "");
 //r->Print();
 //TF1* pRes = graph->GetFunction("Novosibirsk");

 //(TVirtualFitter::GetFitter())->SetCache(0, 0);
 //(TVirtualFitter::GetFitter())->Clear("s");
 //delete (TVirtualFitter::GetFitter());
}
delete graph;
delete pFit;
}
// graph->Fit()… - no memory leak
void FitOscillograms()
{
vector<Double_t> data {12, 0, 15, -2, 6, -2, 6, 0, -14, -11, 22, -3, 21, 3, -22, -651, -2131, -3031, -3323, -2923, -2579, -2267, -1899, -1603, -1299, -1075, -875, -719, -563, -459, -347, -299, -219, -195, -147, -143, -103, -91, -48, -50, -23, -10, 3, 2, 16, 10, 32, 14, 17, -10, 6, -3, 4, 3, 17, 8, 7, -1, 13, 3};
Double_t MaxDelta = 3323;
Double_t BinMax = 19;
TGraphErrors* graph = new TGraphErrors(60);
for(int i = 0; i < 60; i++)
{
graph->SetPoint (i, i, 0 - data[i]);
graph->SetPointError(i, 0, 5);
}
TF1* pFit = new TF1(“Novosibirsk”, Novosibirsk, 0., 60, 4);
pFit->SetParameters(MaxDelta, 0.05, 8., BinMax);
for (int j = 0; j < 60000000 ; j++)
{
if(j%10 == 0) {
cout << "\nCount# " << j << endl;
}
 /*TFitResultPtr r = *///graph->Fit(pFit, "QR0", "");
 //r->Print();
 //TF1* pRes = graph->GetFunction("Novosibirsk");

 //(TVirtualFitter::GetFitter())->SetCache(0, 0);
 //(TVirtualFitter::GetFitter())->Clear("s");
 //delete (TVirtualFitter::GetFitter());
}
delete graph;
delete pFit;
}
It seems you are claiming the memory size increases while running the macro ? right ? not when you are executing the macro several times ? In that case I do not see any memory leak with:
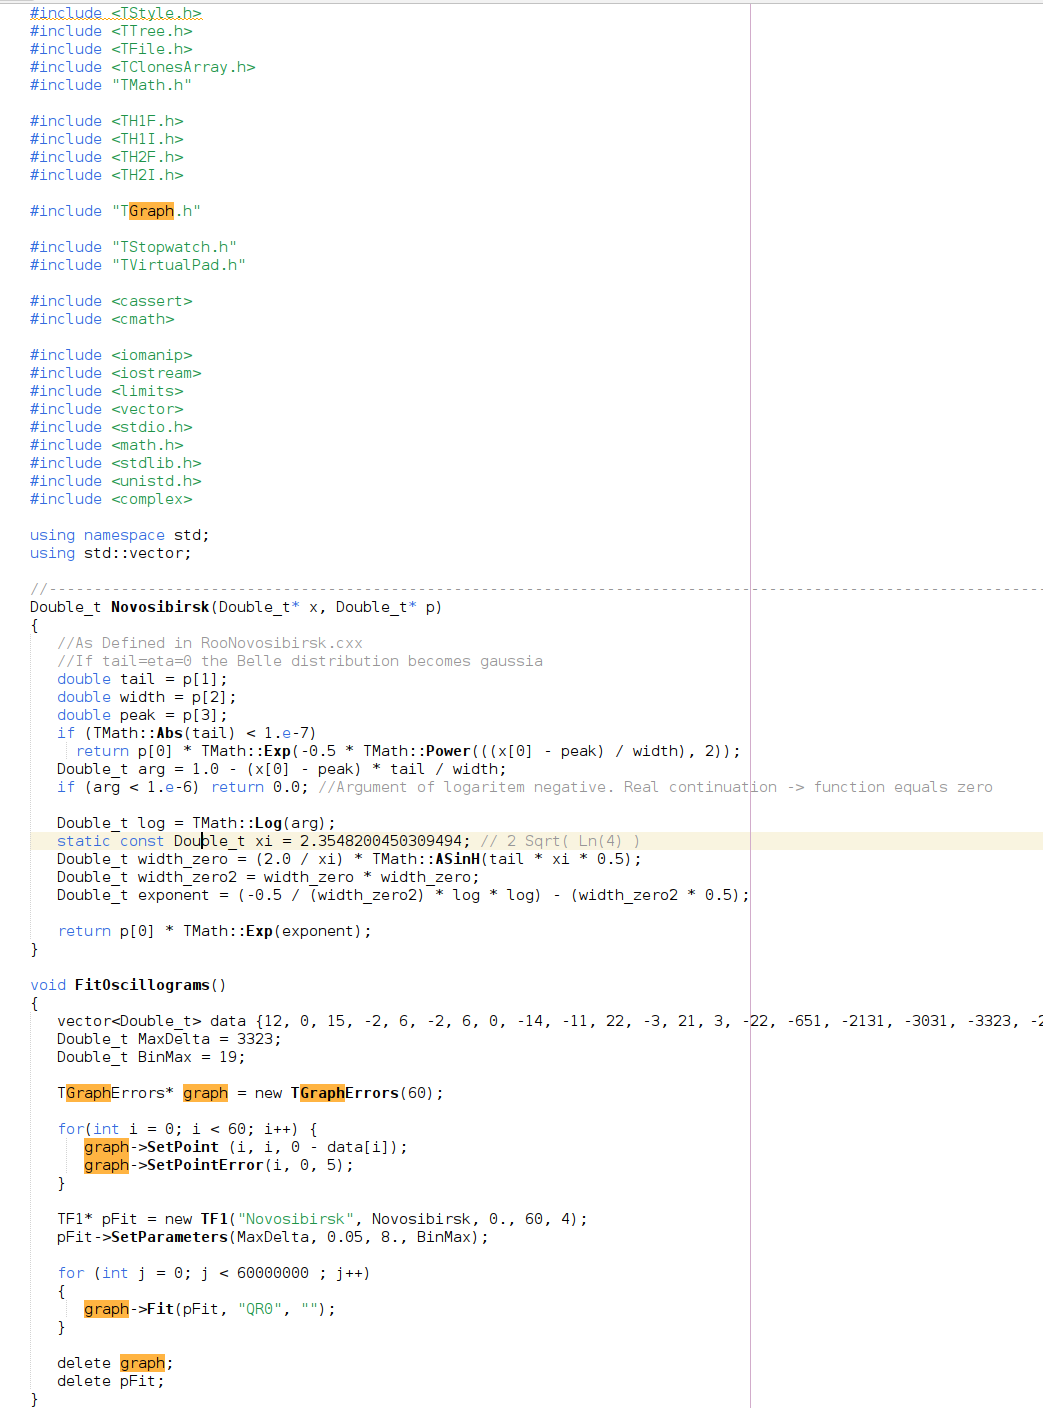
Double_t Novosibirsk(Double_t* x, Double_t* p)
{
   //As Defined in RooNovosibirsk.cxx
   //If tail=eta=0 the Belle distribution becomes gaussia
   double tail = p[1];
   double width = p[2];
   double peak = p[3];
   if (TMath::Abs(tail) < 1.e-7)
     return p[0] * TMath::Exp(-0.5 * TMath::Power(((x[0] - peak) / width), 2));
   Double_t arg = 1.0 - (x[0] - peak) * tail / width;
   if (arg < 1.e-6) return 0.0; //Argument of logaritem negative. Real continuation -> function equals zero

   Double_t log = TMath::Log(arg);
   static const Double_t xi = 2.3548200450309494; // 2 Sqrt( Ln(4) )
   Double_t width_zero = (2.0 / xi) * TMath::ASinH(tail * xi * 0.5);
   Double_t width_zero2 = width_zero * width_zero;
   Double_t exponent = (-0.5 / (width_zero2) * log * log) - (width_zero2 * 0.5);

   return p[0] * TMath::Exp(exponent);
}

void FitOscillograms()
{
   vector<Double_t> data {12, 0, 15, -2, 6, -2, 6, 0, -14, -11, 22, -3, 21, 3, -22, -651, -2131, -3031, -3323, -2923, -2579, -2267, -1899, -1603, -1299, -1075, -875, -719, -563, -459, -347, -299, -219, -195, -147, -143, -103, -91, -48, -50, -23, -10, 3, 2, 16, 10, 32, 14, 17, -10, 6, -3, 4, 3, 17, 8, 7, -1, 13, 3};
   Double_t MaxDelta = 3323;
   Double_t BinMax = 19;

   TGraphErrors* graph = new TGraphErrors(60);

   for(int i = 0; i < 60; i++) {
      graph->SetPoint (i, i, 0 - data[i]);
      graph->SetPointError(i, 0, 5);
   }

   TF1* pFit = new TF1("Novosibirsk", Novosibirsk, 0., 60, 4);
   pFit->SetParameters(MaxDelta, 0.05, 8., BinMax);

   for (int j = 0; j < 60000000 ; j++)
      graph->Fit(pFit, "QR0", "");
   }

   delete graph;
   delete pFit;
}
it is stable at 77.5 MB
Yes, I claim that the amount of memory increases during the execution of the macro. That’s what surprises me. For reliability, I used the code that you attached and attached a screenshot with the archived video.
As I said the last example I ran on my Mac shows a stable memory usage. As it is related to fitting may be @moneta might have an idea about it.
I also see stable memory usage with 6.30.04 on Ubuntu 22.04.
I suggest you try running it with valgrind.
==355611== HEAP SUMMARY:
==355611== in use at exit: 128,157,684 bytes in 200,175 blocks
==355611== total heap usage: 7,128,345 allocs, 6,928,170 frees, 1,679,837,281 bytes allocated
==355611==
==355611== LEAK SUMMARY:
==355611== definitely lost: 20,149,304 bytes in 179,900 blocks
==355611== indirectly lost: 0 bytes in 0 blocks
==355611== possibly lost: 51,480 bytes in 770 blocks
==355611== still reachable: 107,956,900 bytes in 19,505 blocks
==355611== of which reachable via heuristic:
==355611== newarray : 1,208 bytes in 1 blocks
==355611== multipleinheritance: 3,552 bytes in 6 blocks
==355611== suppressed: 0 bytes in 0 blocks
==355611== Rerun with --leak-check=full to see details of leaked memory
==355611==
==355611== Use --track-origins=yes to see where uninitialised values come from
==355611== For lists of detected and suppressed errors, rerun with: -s
==355611== ERROR SUMMARY: 298 errors from 53 contexts (suppressed: 0 from 0)
example.txt (100.1 KB)
Mm can you repost, but running it with: --leak-check=full --suppressions=/opt/root_src/etc/valgrind-root.supp
example1.txt (37.6 KB)
It seems that this leak is the same as in: Valgrind reports leak when constructing TChain · Issue #13130 · root-project/root · GitHub
Can you try with ROOT 6.30.04 instead? I think the memory leak was fixed in the meanwhile.
Yes, you were right. The problem was this, there is no memory leak in the root of the latest version when executing this macro.
Thanks!