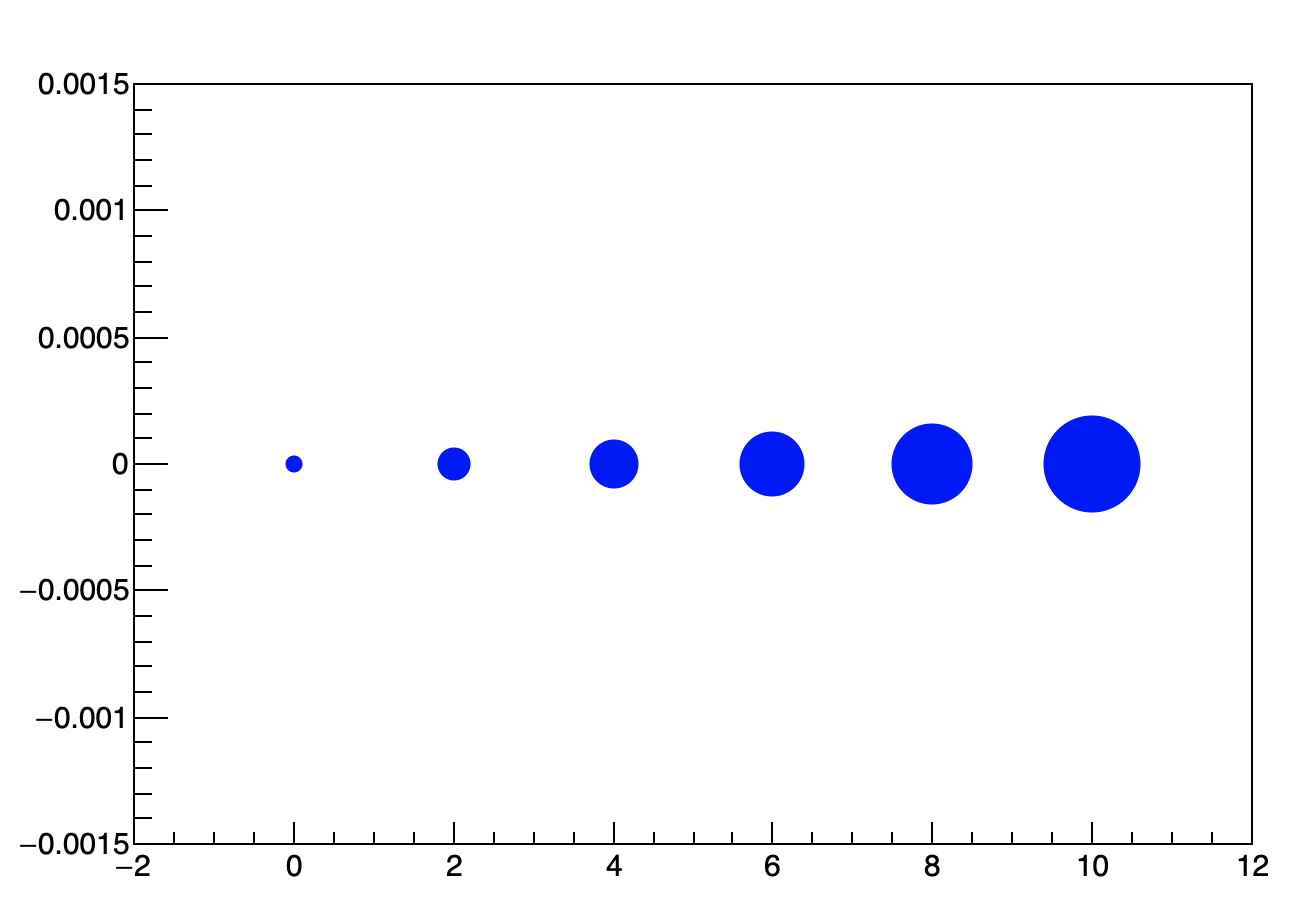
Dear experts,
Is it possible to draw a graph where the each data point has a different size!?
As can be done in pyplot scatter plot.
Thank you in advance,
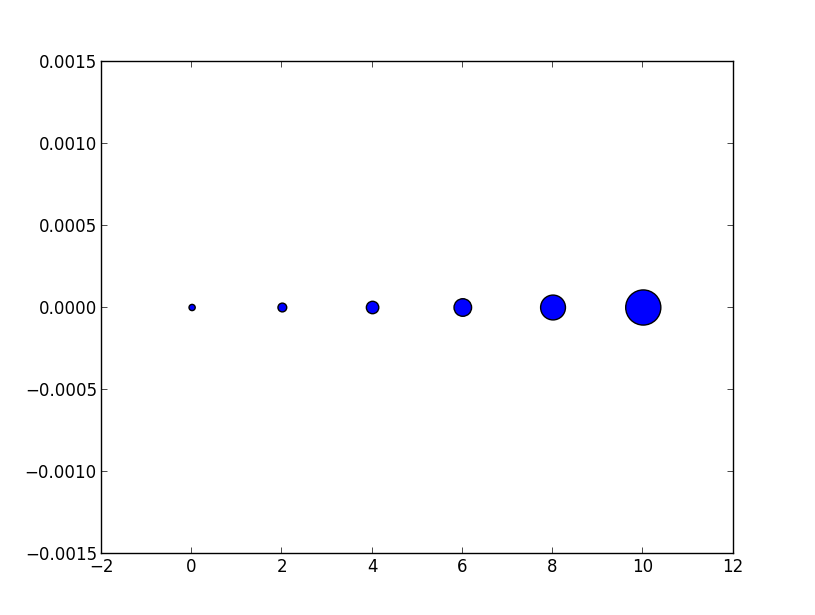
Dear experts,
Is it possible to draw a graph where the each data point has a different size!?
As can be done in pyplot scatter plot.
Thank you in advance,
To achieve such plot, I would say you should define a TMultigraph that includes several TGraph. Each TGraph with a SetMarkerSize with a different value. I did not try but it should work.
ROOT is fexlible enough to produce easily a such plot with a simple macro.
In graphsizemarker.C (503 Bytes) I wrote a small generic function doing that. You can copy and use it in your code.
Many thanks for the suggestion and the code
Hi,
in case you want to profit of a real TGraph (fitting etc)
you can do the att trick:
graph_var_points.C (678 Bytes)
Draw an invisible graph and overlay with markers of your choice.
Otto
Thanks Otto. This one makes it a bit more modular. graph_var_points.C (883 Bytes)
Interesting, Many thanks
