Mark different regions in a 3D scatter plot

Dear root people,

Now there is a 3-D scatter plot ( e.g. the distribution of 3 particles’ mass). I am trying to find a way to mark the different regions of this distribution.

for example, (|m1| < 20, |m2| < 20, |m3| < 20) and (40<|m1|<60, 40<|m2|<60, 40<|m3|<60) are two regions I would like to highlight.

I am wondering if I could set different marker color for these two parts or draw a 3-d cube to show the region, while, unfortunately, i’ve no idea about how to realize either of these methods.

It will be so kind if you could give me some ideas.

The 3D plot in that example may help you:
root.cern.ch/doc/master/ntuple1_8C.html

Thanks a lot.

I’ve tried that and it works but doesn’t look so good in my plot. For it is a combination of three normal distributions, this method works in the central area but for the side region as i mentioned in the question the difference of color can hardly be recognized.

So i wonder if it is possible to draw a box or just user-defined lines in a 3-d scatter plot to show these regions, or, does TShape work with TNuple?

[quote=“couet”]The 3D plot in that example may help you:
root.cern.ch/doc/master/ntuple1_8C.html[/quote]

Can you post the picture you get ?

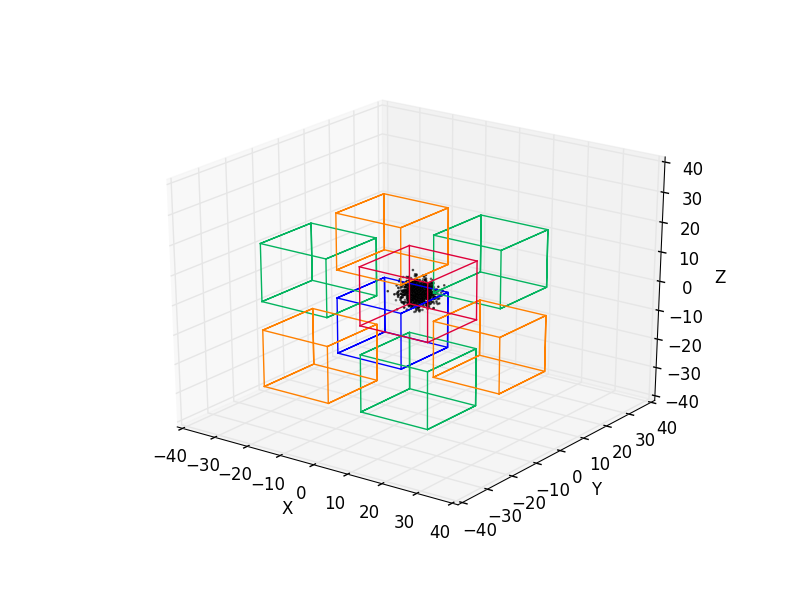
Here is my plot and my source code, the points are generated by gRandom and the data will be just like it (the data is not available now).

void plot() {
    TCanvas *cvs = new TCanvas("cvs", "", 800, 600);
    gStyle->SetCanvasColor(0);
    gStyle->SetMarkerStyle(7);
    Int_t palette[5];
    palette[0] = 19;
    palette[1] = 46;
    palette[2] = 6;
    palette[3] = 30;
    palette[4] = 38;
    gStyle->SetPalette(5,palette);

    TNtuple *n = new TNtuple("n", "n", "x:y:z:color");
    for (Int_t i = 0; i < 10000; i++) {
        Float_t x, y, z;
        x=gRandom->Gaus(0, 10);
        y=gRandom->Gaus(0, 10);
        z=gRandom->Gaus(0, 10);
        n->Fill(x, y, z, setcolor(x, y, z));
    }
    for (Int_t i = 0; i < 3000; i++) {
        Float_t x, y, z;
        x=gRandom->Uniform(-40, 40);
        y=gRandom->Uniform(-40, 40);
        z=gRandom->Uniform(-40, 40);
        n->Fill(x, y, z, setcolor(x, y, z));
    }
    for (Int_t i = 0; i < 3000; i++) {
        Float_t x, y, z;
        x=gRandom->Gaus(0, 10);
        y=gRandom->Gaus(0, 10);
        z=gRandom->Uniform(-40, 40);
        n->Fill(x, y, z, setcolor(x, y, z));
        n->Fill(x, z, y, setcolor(x, z, y));
        n->Fill(z, y, x, setcolor(z, y, x));
    }
    n->Draw("x:y:z:color");
}

Int_t setcolor(Float_t x, Float_t y, Float_t z){
    Int_t color = 10;
    if (abs(x)<10 && abs(y)<10 && abs(z)<10) color = 50;
    if ((abs(x)>20 && abs(x)<40 && abs(y)<10 && abs(z)<10)||
        (abs(y)>20 && abs(y)<40 && abs(x)<10 && abs(z)<10)||
        (abs(z)>20 && abs(z)<40 && abs(x)<10 && abs(y)<10)) 
        color = 40;
    if ((abs(x)>20 && abs(x)<40 && abs(y)>20 && abs(y)<40 && abs(z)<10)||
        (abs(y)>20 && abs(y)<40 && abs(z)>20 && abs(z)<40 && abs(x)<10)||
        (abs(z)>20 && abs(z)<40 && abs(x)>20 && abs(x)<40 && abs(y)<10)) 
        color = 30;
    if (abs(x)>20 && abs(x)<40 && 
        abs(y)>20 && abs(y)<40 && 
        abs(z)>20 && abs(z)<40) 
        color = 20;
    return color;
}

I was working on the palette but it looks like a mess, while it’s pretty good on the x-y (or other projection) plane. Maybe it’s not a good idea to do this in a 3-d plot.


It looks fine seems to me … what do you not like ? have you try to use transparency ?
root.cern.ch/doc/master/classTColor.html#C07

Well… i am not sure whether this picture is clear enough to show the locations of parts. Maybe i am being too demanding.

Thank you for your advice! Hope transparency will make it better.

I have turned to python for better looking plot. With matplotlib i was able to do this and i wonder if it’s possible to draw a similar scatter plot with ROOT.


Yes there is also the option BOX in ROOT for 3D plots.