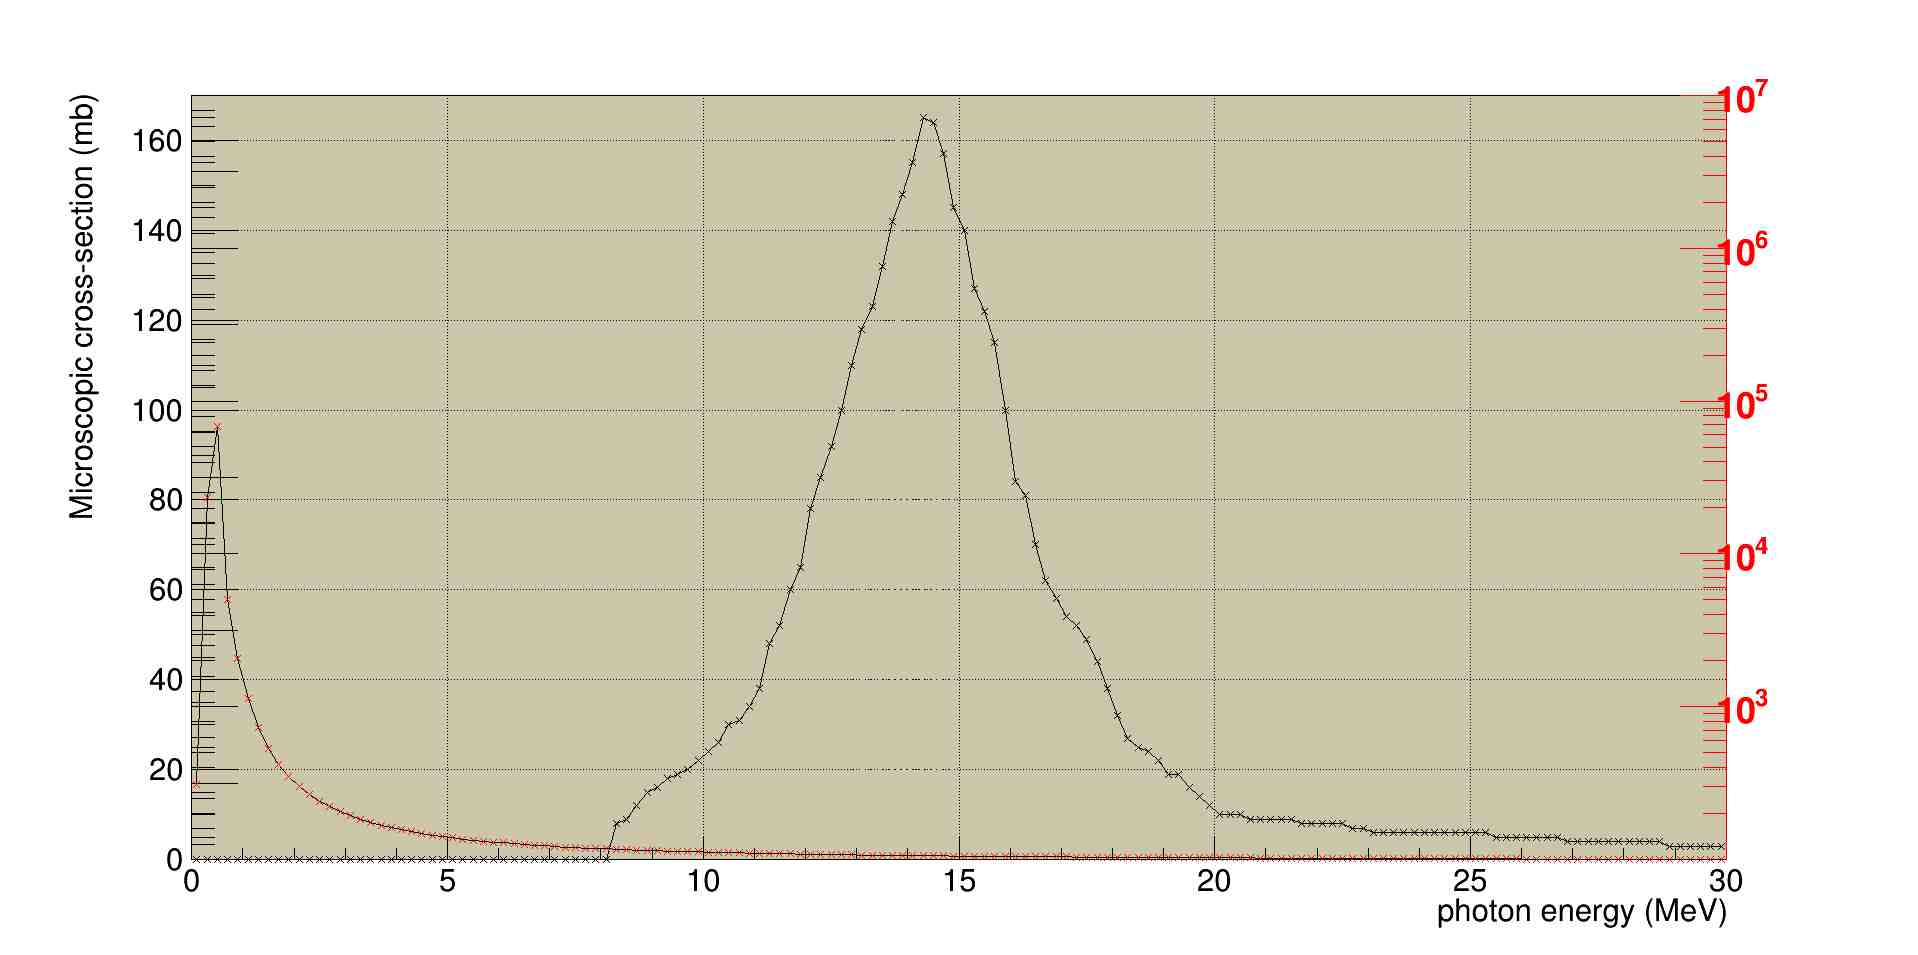
I have to plot two graphs with different Y-axes on one single pad. I have tried it by making another transparent pad over my existing canvas pad and Added new Y-Axis. It was suggested in some Root Forum itself.
I am unable to do the following things
- name the new Y-Axis
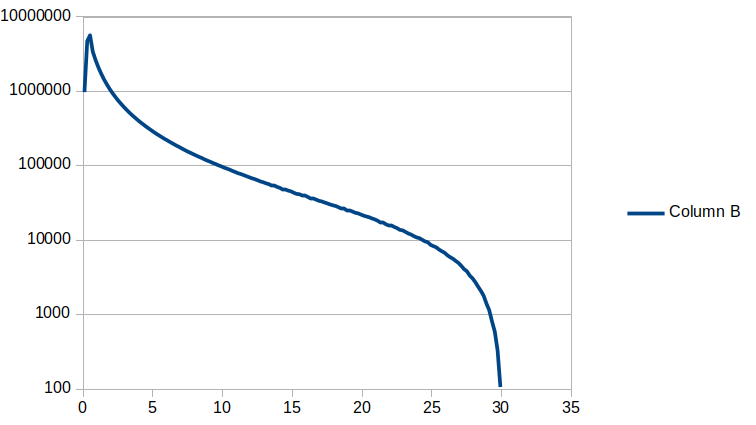
2)make the new Y-Axis in logarithmic format.
I have tried using
   c1.SetLogy();
   gPad->SetLogy();
But gives either some weird graph or doesn’t plot my second graph at all.
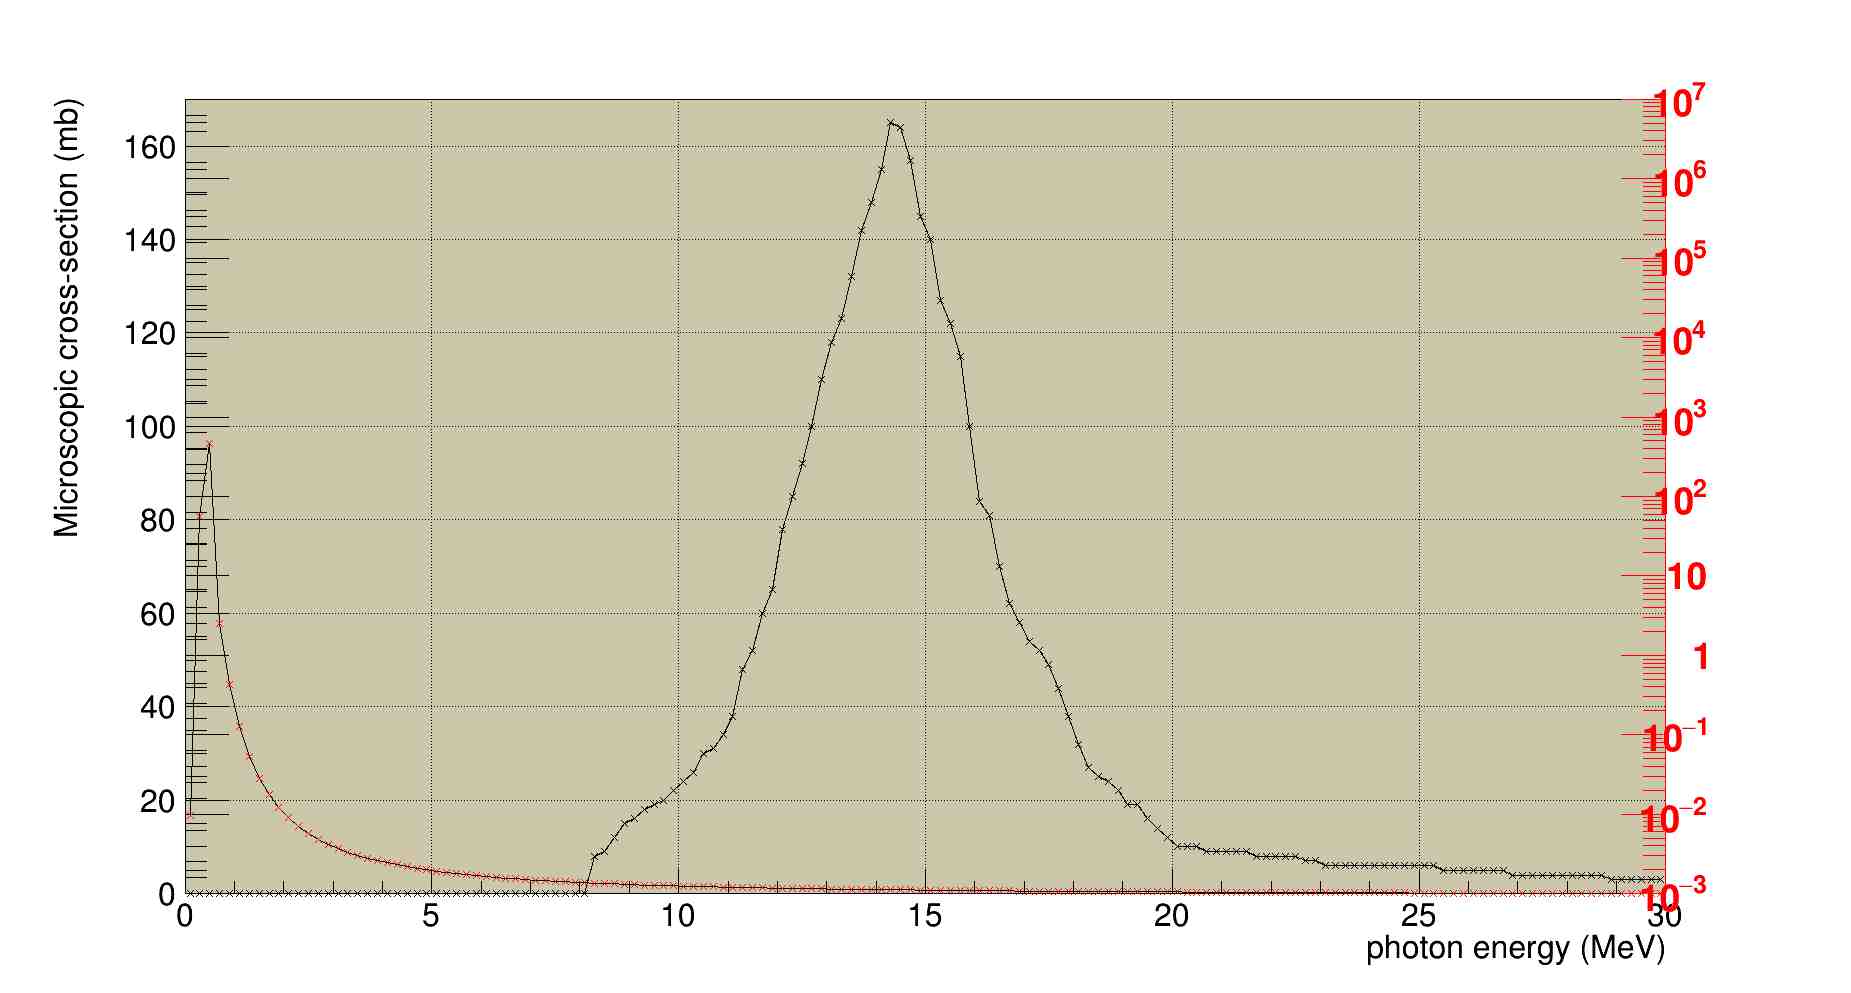
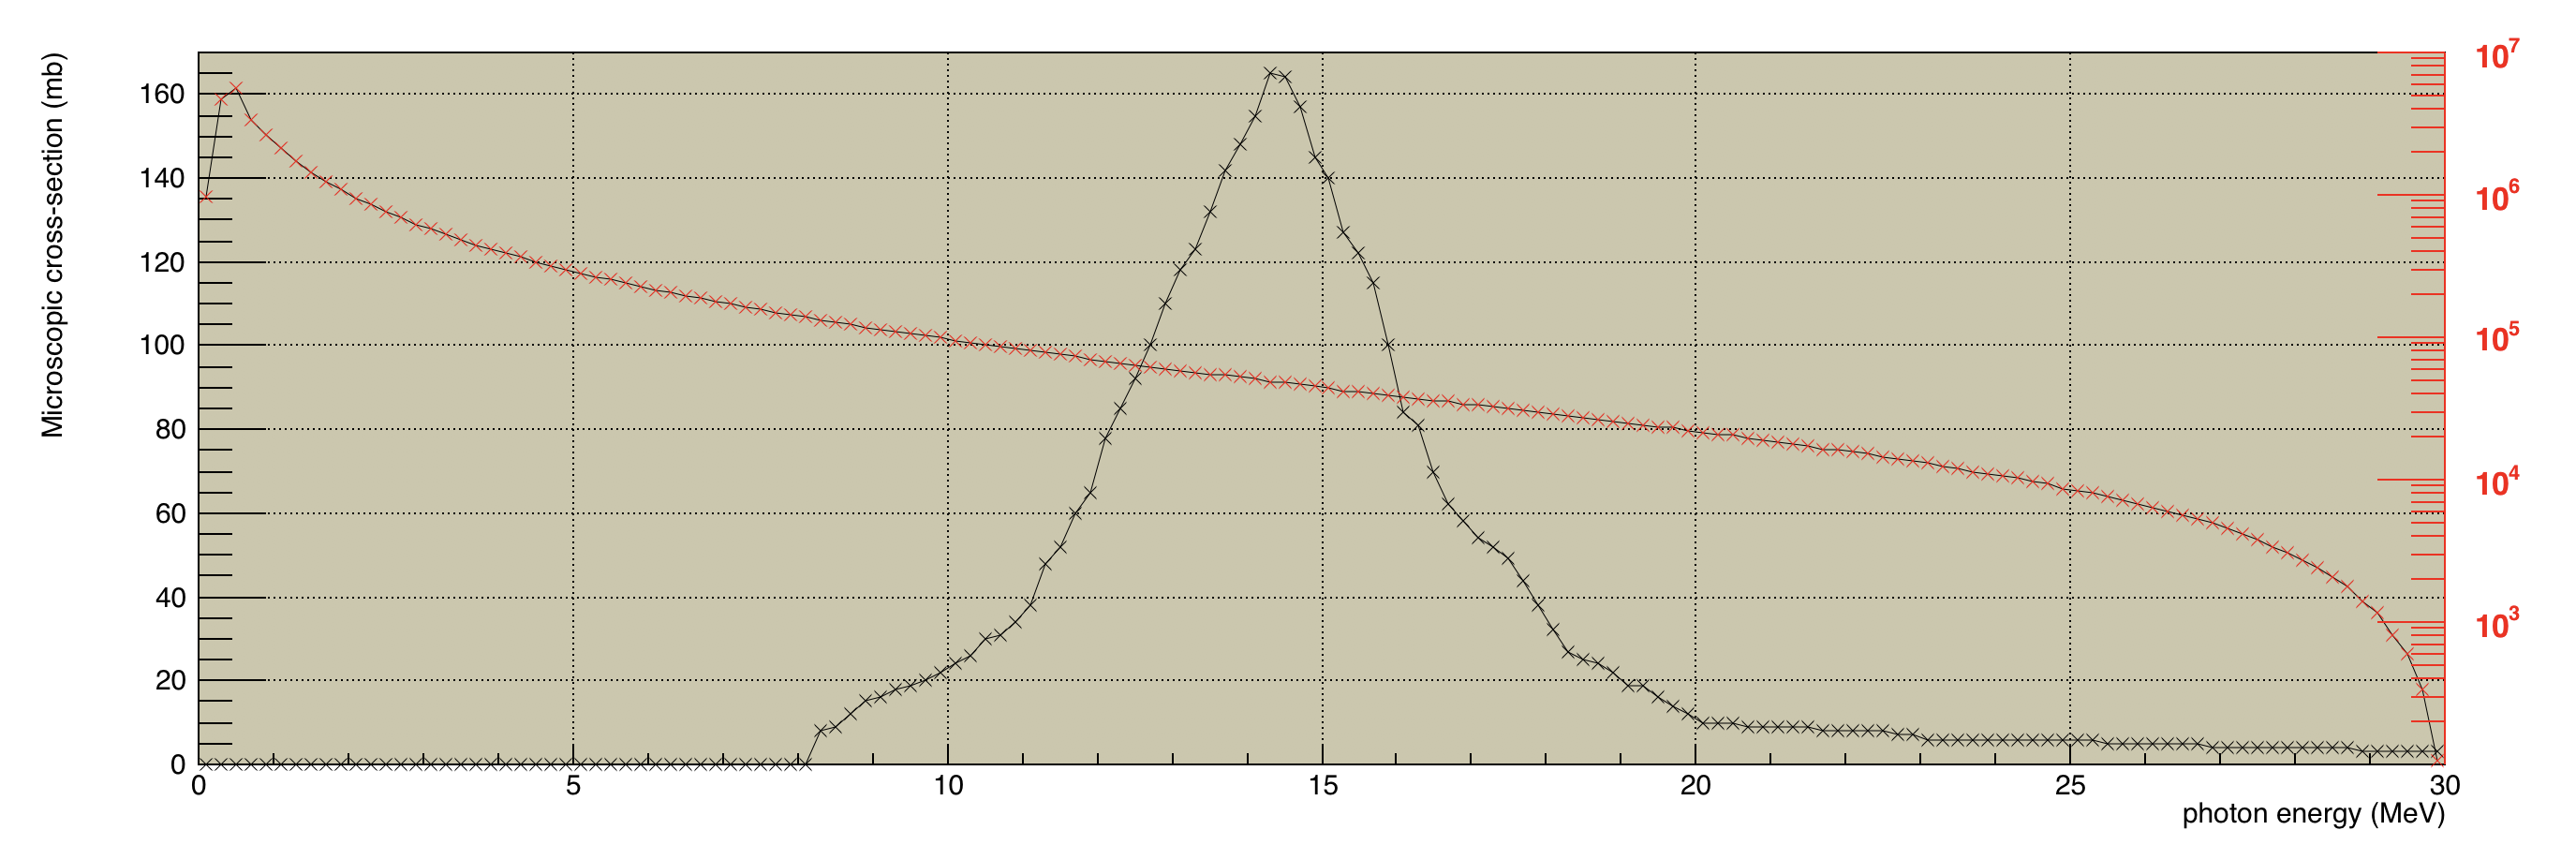
3) It plots two lines for both the graphs and those two lines are not overlapping properly , So it looks ambiguous.
I am using the following code:
//Plotting two graphs with different y scale on one root canvas
{
gROOT->Reset();
c1 = new TCanvas("c1","cross-section with photon flux",1500,500);
TPad *pad = new TPad("pad","",0,0,1,1);
pad->SetFillColor(42);
pad->SetGrid();
pad->Draw();
pad->cd();
// draw a frame to define the range
TH1F *hr = c1->DrawFrame(0,0,30,170); //(x-axis initial, y- axis initial, x-axis final, y-axis final)
hr->SetXTitle("photon energy (MeV)");
hr->SetYTitle("Microscopic cross-section (mb)");
pad->GetFrame()->SetFillColor(21);
pad->GetFrame()->SetBorderSize(12);
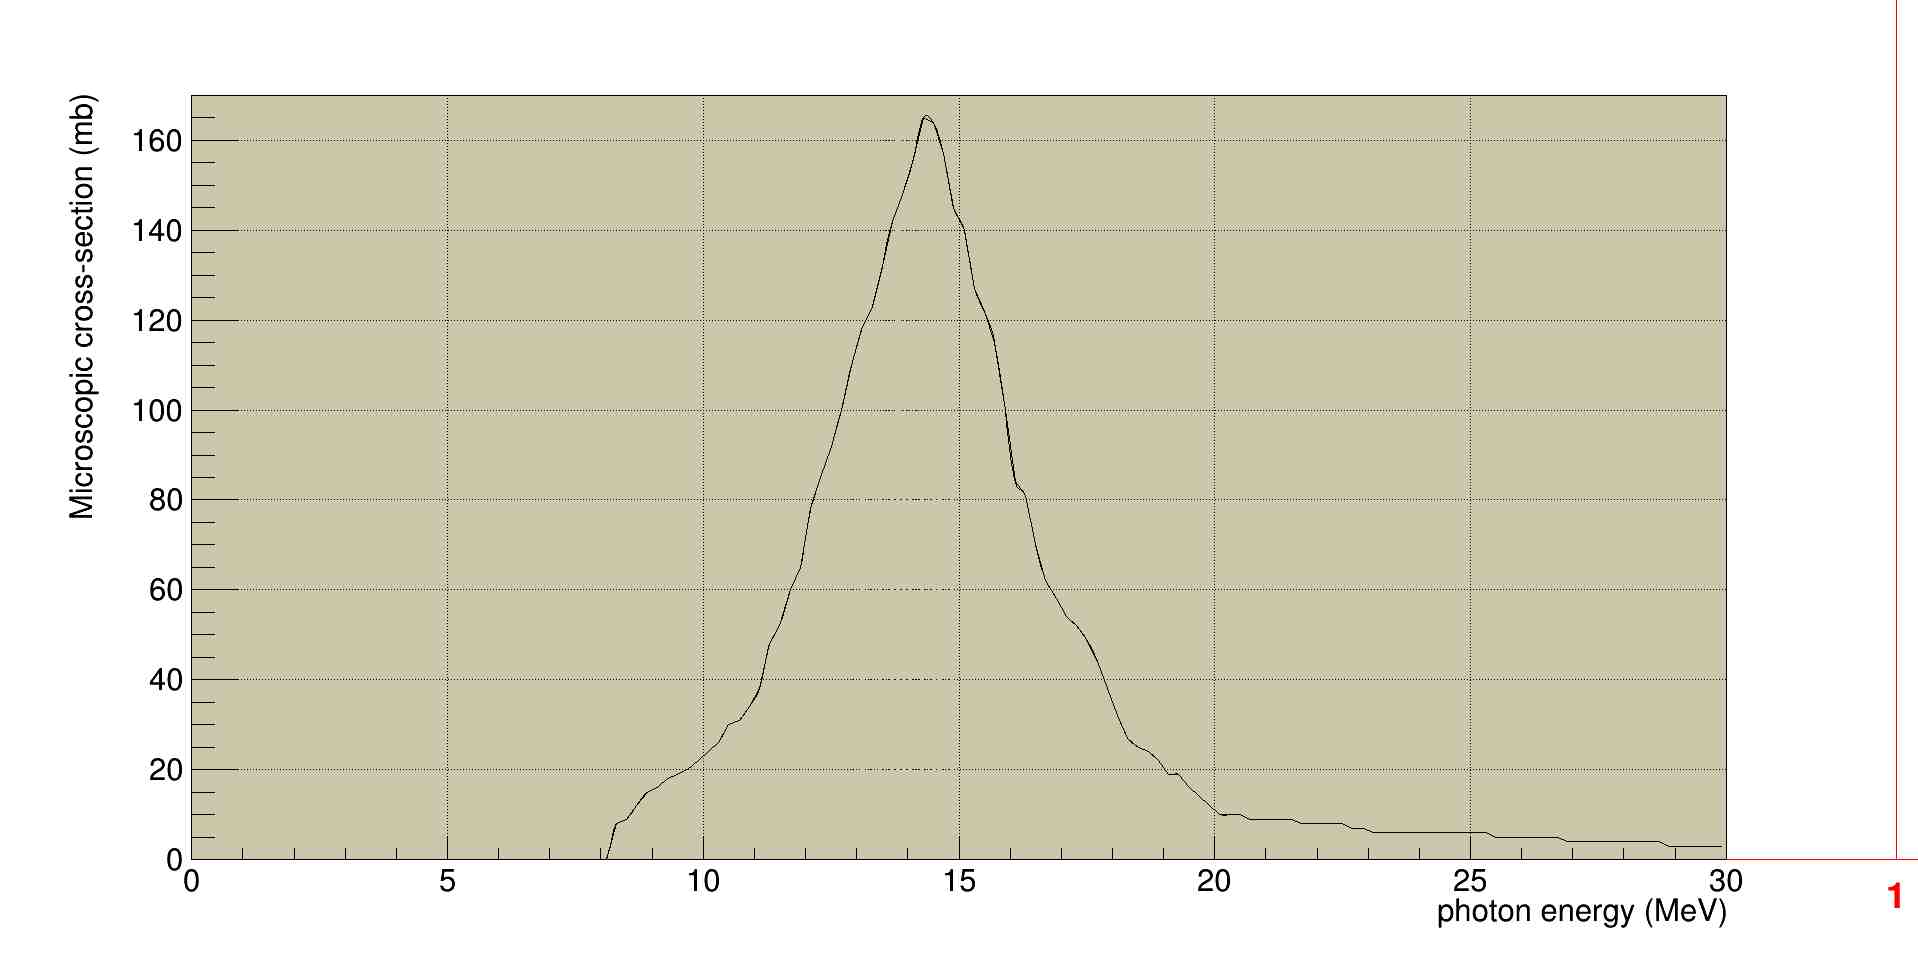
// create first graph
g1= new TGraph("cross_section.dat"); //Create a graph for a text file saved in the same directory as this program
g1-> SetMarkerStyle(5); //Marker styles can be found under view toolbar in the canvas
g1-> Draw ("CL"); //Draw with Axes, Points and Curve. If you used L in the place of C, It will join the data points with straight lines and not smooth curves.
//create a transparent pad drawn on top of the main pad
c1->cd();
TPad *overlay = new TPad("overlay","",0,0,1,1);
overlay->SetFillStyle(4000);
overlay->SetFillColor(0);
overlay->SetFrameFillStyle(4000);
overlay->Draw();
overlay->cd();
//Create the second graph
g2= new TGraph("phflx.dat");
g2->SetMarkerColor(kRed);
g2->SetMarkerStyle(5);
g2->SetName("g2");
TH1F *hframe = overlay->DrawFrame(0,0,30,10000000); //(xmin, ymin(second y axis), xmax, ymax(second y axis))
hframe->GetXaxis()->SetLabelOffset(99);
hframe->GetYaxis()->SetLabelOffset(99);
g2->Draw("CL");
//Draw an axis on the right side
TGaxis *axis = new TGaxis(30,0,30, 10000000,0,10000000,80506,"+L"); //(xmax, xmin, xmax, ymax(second y axis), ymin, ymax(second y axis),type, marker place)
//overlay->SetLogy(1);
axis->SetLineColor(kRed);
axis->SetLabelColor(kRed);
axis->Draw();
}
Kindly Help.

 :)
:)
