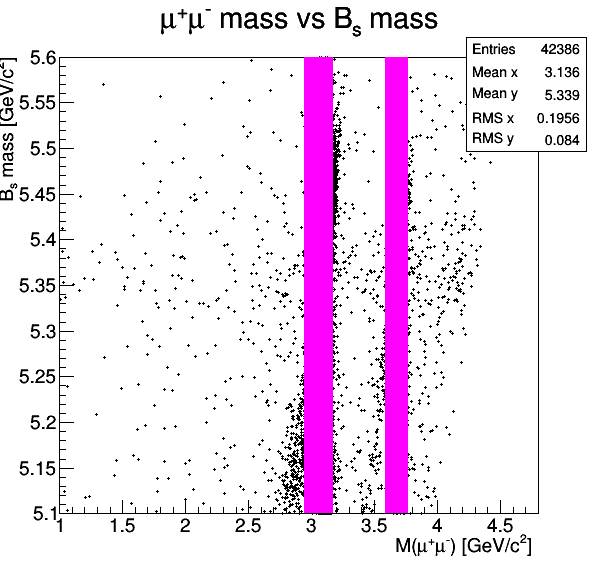
I have plotted scatter plot as attached. I have drawn two bars on that plot. I want to make these two bars transparent so that I can see the data points. I have written in the macro as below.
TCanvas *cv1 = new TCanvas(“cv1”,"",600,600);
tr->Draw(“Bmass : Mumumass >> h_mm”,selbm1);
TBox *bx1 = new TBox(2.946,5.1,3.177,5.6);
bx1->SetFillColor(kMagenta);
bx1->Draw();
TBox *bx2 = new TBox(3.586,5.1,3.766,5.6);
bx2->SetFillColor(kMagenta);
bx2->Draw();
The transparency is available on all platforms when the flag OpenGL.CanvasPreferGL is set to 1 in $ROOTSYS/etc/system.rootrc, or on Mac with the Cocoa backend. On the file output it is visible with PDF, PNG, Gif, JPEG, SVG … but not PostScript.