Making an histogram showing bin content from data file

Hello,

I have a set of data in a text file with three columns and I want to make a plot/histogram like the one shown below Screenshot from 2021-11-09 21-34-41

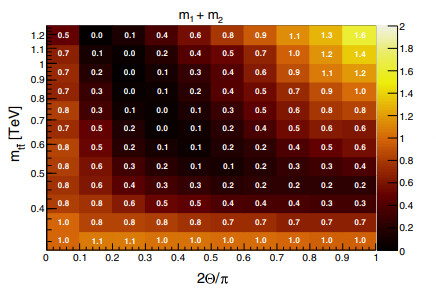
I would appreciate some help to identify this kind of plot and the ROOT class I should use, so I can try to reproduce it.

Thanks

ROOT Version: 6.24/01
Platform: Ubuntu 21.04
Compiler: Not Provided


THistPainter → Options supported for 2D histograms
THistPainter → The TEXT and TEXTnn Option
TColor → Color palettes

Basically you need to do:

your_2d_histo->Draw("colz text")

@couet you forgot to set the right palette :wink:

Indeed … :wink:
And the text color too… So:

 gStyle->SetPalette(kDarkBodyRadiator);
 your_2d_histo->SetMarkerColor(kWhite);
 your_2d_histo->Draw("colz text");