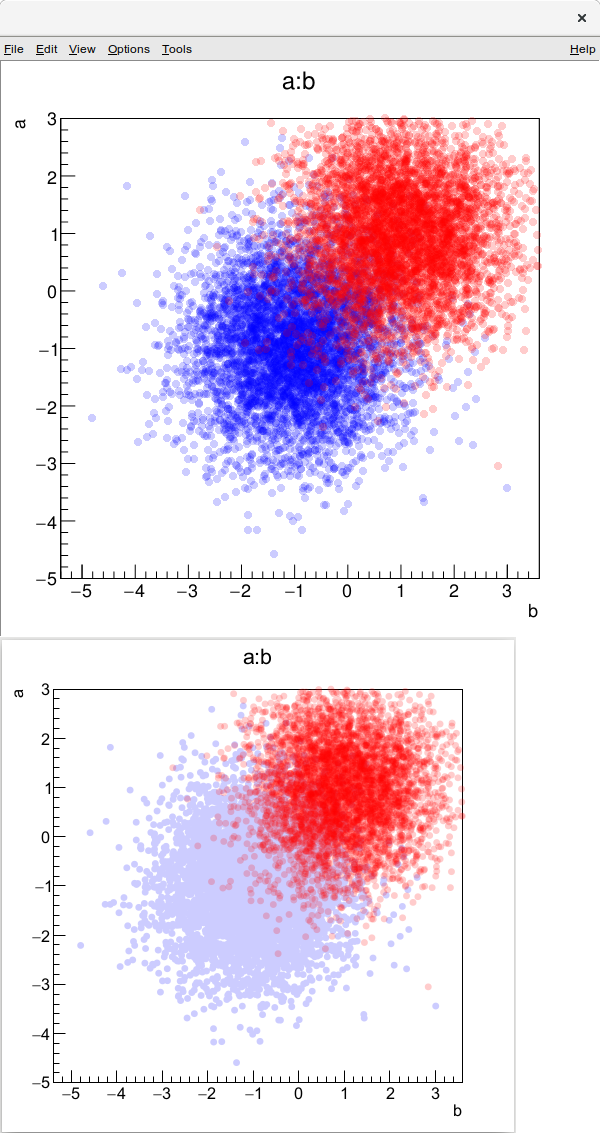
Hi, I have this test case where I’m plotting two simple scatter plots with semi-transparent markers.
Here’s the output (sorry for the odd tiled image, forum prevents two uploads for new users…). On top when I view it from GUI, rendered correctly. Bottom the same plot saved as pdf and rendered with evince. See the wrong transparency on the blue plot.
I’m pretty new with ROOT, looks like a bug to me, but I could totally be doing something wrong. Here’s the code, compiling it with
clang++ -Wall `root-config --cflags --libs` -lGL -o testalpha testalpha.C
By the way, is there a way to get automatic canvas ranges to extend to both scatterplots when drawing from TTree::Draw?
#include <TROOT.h>
#include <TRandom3.h>
#include <TStyle.h>
#include <TCanvas.h>
#include <TNtuple.h>
#include <TApplication.h>

void testalpha() {
    TNtuple *ntu=new TNtuple("ntu", "ntu", "a:b:c:d");

    for (int i=0; i < 5000; i++) {
        double a = gRandom->Gaus()-1;
        double b = gRandom->Gaus()-1;
        double c = gRandom->Gaus()+1;
        double d = gRandom->Gaus()+1;

        ntu->Fill(a, b, c, d);
    }

    auto c = new TCanvas("ctest", "", 600, 600);
    ntu->SetMarkerStyle(20);
    ntu->SetMarkerColorAlpha(kBlue, .2);
    ntu->Draw("a:b");
    ntu->SetMarkerStyle(20);
    ntu->SetMarkerColorAlpha(kRed, .2);
    ntu->Draw("c:d", "", "same");

    c->Draw();
    c->SaveAs("testalpha.pdf");
}

int main(int argc, char *argv[]) {
    TApplication app("app", &argc, argv);
    gStyle->SetCanvasPreferGL(true);
    testalpha();
    app.Run();

    return 0;
}
ROOT Version : 6.19/01 (heads/master@v6-19-01-562-g07764afae9)Platform: Ubuntu 18.10Compiler: clang++ 7.0.0
couet
July 25, 2019, 7:38am
2
Yes i see this effect too … I need to investigate
Thank you, no particular hurry here
couet
July 25, 2019, 12:39pm
4
To keep track here is what I found. The following shorter exemple reproduces the issue:
void testalpha() {
    TNtuple *ntu=new TNtuple("ntu", "ntu", "a:b:c:d");

    for (int i=0; i < 500; i++) {
        double a = gRandom->Gaus()-1;
        double b = gRandom->Gaus()-1;
        double c = gRandom->Gaus()+1;
        double d = gRandom->Gaus()+1;

        ntu->Fill(a, b, c, d);
    }

    auto c = new TCanvas("ctest", "", 600, 600);
//    double x2=5; // not ok
    double x2=4; //  ok

    c->DrawFrame(-5,-4,x2,5);
    ntu->SetMarkerStyle(20);
    ntu->SetMarkerColorAlpha(kBlue, .2111);
    ntu->Draw("c:d","","same");

    c->SaveAs("testalpha.pdf");
}
changing the value of x2 make it work … or not …
Can confirm it, definitely weird… thanks for looking into it. It also seems something that happens with the first histogram only, if I keep adding semitransparent scatter plots on top of the first one they all get rendered properly while the first one looks flattened or something.
couet
July 26, 2019, 6:50am
6
for some reasons it seems the range of the histogram is involved. I am investigating. Yes making a Jira ticket might help to follow it. Thanks
couet
July 26, 2019, 9:34am
7
I think I found the problem. I need to finalise the proper fix.
Great!https://sft.its.cern.ch/jira/browse/ROOT-10247
Please let me know if I can be of any help with the debugging and/or testing process. Thanks again.
couet
July 26, 2019, 3:23pm
9
Thanks. No that’s ok. I know what it is … on the way to fix it
1 Like
couet
July 26, 2019, 3:47pm
10
Now fixed in master. Thanks for reporting.
1 Like
system
August 9, 2019, 3:47pm
11
This topic was automatically closed 14 days after the last reply. New replies are no longer allowed.