Dear All,
My code is working well but now I want to do some modification that seems to be trivial but I have some trouble to do it.
In fact I am using a file txt named lowmass_a0a0 to plot in a empty graph , now in the same graph I want to do another plot from another file txt named highmass_a0a0 for instance. I guess a loop that can do the same of what the code is doing now should be enough but it has just to do it with the highmass_a0a0 file. I attached the code.
Would apreciate if soemeone could help.
CheersBRHaalimitSetHigh_low_mass.C (6.3 KB)
Can you post a macro we can run ?
Thanks
I think we just need to input files (although I would need these special headers too).
Hi Everyone,
Thanks for replying, yes at the end I just input the files and create a vectors about the number of points since the files have not the same number of lines.
Then I replace this for loop for(Int_t i=0;i<1;i++){…} by this one for(Int_t i=0;i<2;i++){…} but I put the canva and the empty graph before this for loop so it will not be repeated. And it works.
Thanks a lot.
Cheers
Hi Everyone,
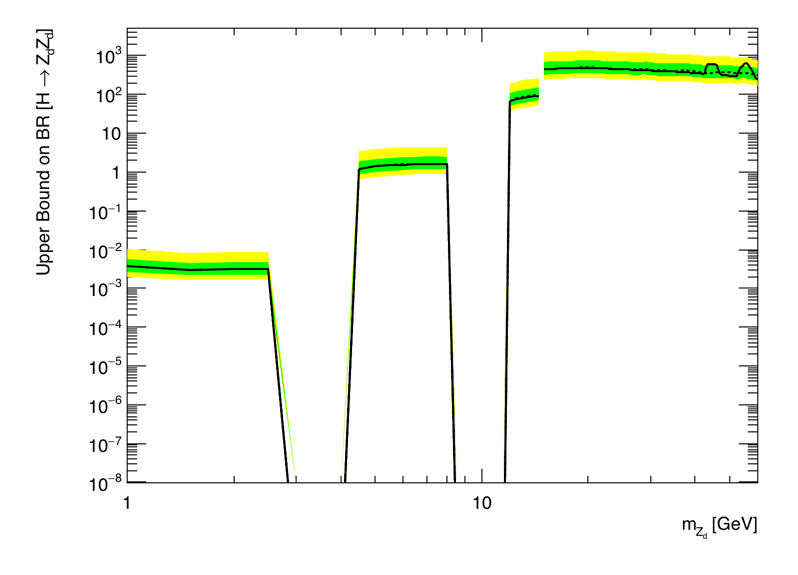
In fact I realized that my problem is only partially resolved. In fact I would like to do the plot using log scale on Y and X axis. I am having error if I use log scale on Y axis that I can understand because there are some zero in Y axis for instance for 3 <= mZd <= 4 and 8.5 <= mZd <= 11.5 the values on Y axis are zero. So I would like hatch these two regions and make a vertical line between low and high mass (low mass goes from zero to 15 and high mass from 15 to 60).
#include "Math/Interpolator.h"
#include <iostream>
#include "AtlasStyle.C"
void BRHaalimitSetHigh_low_mass() {

  TString files_lm[]={"./LowMass_a0a0.txt","HighMass_a0a0.txt"};
  // TString files_hm[]={"./HighMass_a0a0.txt"};
  TString files[]={"./type-1.dat"};
  // TString s[]={"3"};
   TString canv[]={"can3"};

  gSystem->Load("AtlasStyle.C");
  SetAtlasStyle();


  // const unsigned int  Npoints_lm = 28;
  std::vector<unsigned int> Npoints {28,91};
  // Npoints[0]= 28;
  // Npoints[1]= 91;
  // const unsigned int  Npoints_hm = 91;
   const unsigned int  Npoints_fix = 673;
  const unsigned int  Npoints_max = 1000;


  Double_t mzd[Npoints_max];
  Double_t Brall[Npoints_max];


  Double_t ggFSigma[Npoints_max];
  Double_t fac[Npoints_max];


  double mass[Npoints_max];
  double obs[Npoints_max];
  double Exp[Npoints_max];
  double onesiglow[Npoints_max];
  double onesighigh[Npoints_max];
  double twosiglow[Npoints_max];
  double twosighigh[Npoints_max];

    TCanvas *can = new TCanvas(canv[0], canv[0],66,52,800,600);

    can->Range(0,0,1,1);
    can->SetFillColor(0);
    can->SetBorderMode(0);
    can->SetBorderSize(2);
    can->SetFrameBorderMode(0);
     can->SetLogx();
      can->SetLogy();

    //Plot the observed limits
    TGraphErrors *gre = new TGraphErrors(Npoints_max);
    gre->SetName("CLs_observed");
    gre->SetTitle("Observed CLs");
    gre->SetFillColor(1);
    gre->SetLineColor(1);
    gre->SetLineWidth(2);
    gre->SetMarkerStyle(20);

    // cout<<Exp[0]*(ggFSigma[0])<<endl;


    TH1F *Graph_CLs_observed1 = new TH1F("Graph_CLs_observed1","",100,1,60);
    Graph_CLs_observed1->SetMinimum(1.0e-8);
    Graph_CLs_observed1->SetMaximum(5000);
    Graph_CLs_observed1->SetDirectory(0);
    Graph_CLs_observed1->SetStats(0);
    TGaxis *yaxis = (TGaxis*)Graph_CLs_observed1->GetYaxis();
    yaxis->SetMaxDigits(2);

    Int_t ci;   // for color index setting
    Int_t cii;
    ci = TColor::GetColor("#000099");
    Graph_CLs_observed1->SetLineColor(ci);
    Graph_CLs_observed1->GetXaxis()->SetTitle("m_{Z_{d}} [GeV]");
    Graph_CLs_observed1->GetXaxis()->SetLabelFont(42);
    Graph_CLs_observed1->GetXaxis()->SetLabelSize(0.035);
    Graph_CLs_observed1->GetXaxis()->SetTitleSize(0.035);
    Graph_CLs_observed1->GetXaxis()->SetTitleFont(42);
     Graph_CLs_observed1->GetYaxis()->SetTitle("Upper Bound on BR [H #rightarrow Z_{d}Z_{d}]");
    Graph_CLs_observed1->GetYaxis()->SetLabelFont(42);
    Graph_CLs_observed1->GetYaxis()->SetLabelSize(0.035);
    Graph_CLs_observed1->GetYaxis()->SetTitleSize(0.035);
    Graph_CLs_observed1->GetYaxis()->SetTitleFont(42);
    Graph_CLs_observed1->GetYaxis()->SetTitleOffset(1.85);
    Graph_CLs_observed1->GetZaxis()->SetLabelFont(42);
    Graph_CLs_observed1->GetZaxis()->SetLabelSize(0.035);
    Graph_CLs_observed1->GetZaxis()->SetTitleSize(0.035);
    Graph_CLs_observed1->GetZaxis()->SetTitleFont(42);
    gre->SetHistogram(Graph_CLs_observed1);

    gre->Draw("al");

     //Plot for the expected limits and the pm 1 and 2 sigma fluctuations
    TMultiGraph *multigraph = new TMultiGraph();
    multigraph->SetName("Plot_expected");
    multigraph->SetTitle("Expected Plot");

  for(Int_t i=0;i<2;i++){


    TString tmps;
    ifstream fin_lm(files_lm[i]);
    ifstream fin(files[0]);

    for (Int_t k=0; k<Npoints_fix; k++)
      {
	fin>>tmps;mzd[k]=tmps.IsFloat()?tmps.Atof():0;fin>>tmps; Brall[k]=tmps.IsFloat()?tmps.Atof():0;

      }

    // cout<<Brall[672]<<endl;
    ROOT::Math::Interpolator inter(673, ROOT::Math::Interpolation::kCSPLINE);
    inter.SetData(673, mzd, Brall);

    double invCrossSection = (1.0 / 48.59)*0.001;

    // fin>>tmps;fin>>tmps;fin>>tmps;fin>>tmps;fin>>tmps;fin>>tmps;fin>>tmps;//read first line.

    for (Int_t j=0; j<Npoints[i]; j++)
      {

      fin_lm>>tmps;mass[j]=tmps.IsFloat()?tmps.Atof():0;fin_lm>>tmps; obs[j]=tmps.IsFloat()?tmps.Atof():0; fin_lm>>tmps; Exp[j]=tmps.IsFloat()?tmps.Atof():0; fin_lm>>tmps; onesiglow[j]=tmps.IsFloat()?tmps.Atof():0; fin_lm>>tmps; onesighigh[j]=tmps.IsFloat()?tmps.Atof():0; fin_lm>>tmps; twosiglow[j]=tmps.IsFloat()?tmps.Atof():0; fin_lm>>tmps; twosighigh[j]=tmps.IsFloat()?tmps.Atof():0;

      double interBr = inter.Eval( mass[j] );
      fac[j] =  invCrossSection/ (interBr*interBr);
      ggFSigma[j] = fac[j];
      // cout<<ggFSigma[j]<<endl;

      }

   TGraphAsymmErrors *grae = new TGraphAsymmErrors(Npoints[i]);
    grae->SetName("sig2");
    grae->SetTitle("Expected CLs #pm 2 #sigma");

    ci = TColor::GetColor("#ffff00");
    grae->SetFillColor(ci);

    for ( Int_t j=0; j<Npoints[i]; j++) {
      // if (mass[j] != 0){
      grae->SetPoint(j,mass[j],Exp[j]*(ggFSigma[j]));
	grae->SetPointError(j,0,0,Exp[j]*(ggFSigma[j])-twosiglow[j]*(ggFSigma[j]),twosighigh[j]*(ggFSigma[j])-Exp[j]*(ggFSigma[j]));
	//	cout<<Exp[j] <<endl;}

    }

    multigraph->Add(grae,"3");

    grae = new TGraphAsymmErrors(22);
    grae->SetName("sig1");
    grae->SetTitle("Expected CLs #pm 1 #sigma");

    ci = TColor::GetColor("#00ff00");
    grae->SetFillColor(ci);

    for ( Int_t j=0; j<Npoints[i]; j++ ) {
      grae->SetPoint(j,mass[j],Exp[j]*(ggFSigma[j]));
      grae->SetPointError(j,0,0,Exp[j]*(ggFSigma[j])-onesiglow[j]*(ggFSigma[j]),onesighigh[j]*(ggFSigma[j])-Exp[j]*(ggFSigma[j]));
    }

     multigraph->Add(grae,"3");

    TGraph *graph = new TGraph(Npoints[i]);
    graph->SetName("");
    graph->SetTitle("Expected CLs - Median");
    graph->SetFillColor(1);
    graph->SetLineColor(1);
    graph->SetLineStyle(2);
    graph->SetLineWidth(2);

    for (Int_t j=0; j<Npoints[i]; j++) {
      graph->SetPoint(j,mass[j],Exp[j]*(ggFSigma[j]));
    }

     multigraph->Add(graph,"L");


    TGraph *graphN = new TGraph(Npoints[i]);
    graphN->SetName("SM_crosssections");
    graphN->SetTitle("Total SM Cross-Sections");
    graphN->SetFillColor(1);
    graphN->SetLineColor(2);
    graphN->SetLineStyle(2);
    graphN->SetLineWidth(2);

    for ( Int_t j=0; j<Npoints[i]; j++) {
      graphN->SetPoint(j,mass[j],(ggFSigma[j]));
    }
    // multigraph->Add(graphN,"L");


    //multigraph->Draw("");


    gre = new TGraphErrors(Npoints[i]);
    gre->SetName("CLs_observed");
    gre->SetTitle("Observed CLs");
    gre->SetFillColor(1);
    gre->SetLineColor(1);
    gre->SetLineWidth(2);
    gre->SetMarkerStyle(20);

    for ( Int_t j=0; j<Npoints[i]; j++) {
      gre->SetPoint(j,mass[j],obs[j]*(ggFSigma[j]));
      gre->SetPointError(j,0,0);
      // cout<<obs[j]*(ggFSigma[j])<<endl;
    }

     multigraph->Add(gre,"l");

    // gre->Draw("l");
    multigraph->Draw("");

  }
   TLegend *leg = new TLegend(0.7,0.7,0.9,0.9,NULL,"brNDC");
        leg->SetBorderSize(1);
        leg->SetLineColor(1);
        leg->SetLineStyle(1);
        leg->SetLineWidth(1);
        leg->SetFillColor(19);
        leg->SetFillStyle(1001);

   TLegendEntry * entry=leg->AddEntry("CLs_observed","Observed","L");
        entry->SetLineColor(1);
        entry->SetLineStyle(1);
        entry->SetLineWidth(2);
        entry->SetMarkerColor(1);
        entry->SetMarkerStyle(20);
        entry->SetMarkerSize(1);

        entry=leg->AddEntry("Plot_expected","Expected","l");
        entry->SetLineColor(1);
        entry->SetLineStyle(2);
        entry->SetLineWidth(2);
        entry->SetMarkerColor(1);
        entry->SetMarkerStyle(21);
        entry->SetMarkerSize(1);


        entry=leg->AddEntry("sig1","#pm 1 #sigma","F");
        ci = TColor::GetColor("#00ff00");
        entry->SetFillColor(ci);
        entry->SetFillStyle(1001);
        entry->SetLineColor(1);
        entry->SetLineStyle(1);
        entry->SetLineWidth(1);
        entry->SetMarkerColor(3);
        entry->SetMarkerStyle(21);
        entry->SetMarkerSize(1);
        entry=leg->AddEntry("sig2","#pm 2 #sigma","F");
        ci = TColor::GetColor("#ffff00");
        entry->SetFillColor(2);
        entry->SetFillStyle(1001);
        entry->SetLineColor(1);
        entry->SetLineStyle(1);
        entry->SetLineWidth(1);
        entry->SetMarkerColor(1);
        entry->SetMarkerStyle(21);
        entry->SetMarkerSize(1);
	// leg->Draw();


        TLatex *tex = new TLatex();
	/* tex->SetTextFont(72);
        tex->DrawLatex(17,3.0e-4,"ATLAS");
        tex->SetTextFont(42);
        tex->DrawLatex(24.5,3.0e-4,"Internal");
        tex->DrawLatex(17,3.0e-4,"#sqrt{s} = 13 TeV, 36.5 fb^{-1}");
        tex->DrawLatex(17,2.8e-4,"95% CL");
	// tex->DrawLatex(17,2.6e-4,"Final State: 4e+2e2#mu+4#mu");
	tex->DrawLatex(17,2.6e-4,"Final State: 4#mu");*/


}
For instance here is the plot I got (even with the error caused by the zero on the Y axis).
Here is my code for instance:LowMass_a0a0.txt (1.5 KB)
HighMass_a0a0.txt (4.9 KB)
Thanks in advance.
Cheers
Your macro gives the following output and an empty plot:
Processing BRHaalimitSetHigh_low_mass.C...
Error in <GSLError>: Error 4 in interp.c at 83 : x values must be strictly increasing
Warning in <ROOT::Math::GSLInterpolator::Eval>: input domain error
Warning in <ROOT::Math::GSLInterpolator::Eval>: input domain error
Warning in <ROOT::Math::GSLInterpolator::Eval>: input domain error
Warning in <ROOT::Math::GSLInterpolator::Eval>: input domain error
Warning in <ROOT::Math::GSLInterpolator::Eval>: Suppressing additional warnings
Hi Couet,
Thanks for replying.
It’s a bit strange but it gives the plot I attached, may be we don’t have the same root version. I am using ROOT 6.08/06, or maybe you need these AtlasStyle files, which I am going to attach here. AtlasStyle.h (388 Bytes)
AtlasStyle.C (2.5 KB)
Cheers
I get the same thing with these two files. I tried root master and 6.08/07. It seems to be a Math issue. May be @moneta will have an idea.
Hi Couet,
I think you are right it’s a math issue, I remember I was having the same issue but I did this to resolve it:
cmake -Dmathmore=ON /opt/root/root-6.08.06 -DCMAKE_INSTALL_PREFIX=/opt/root/root-6.08.06_install/
where /opt/root/root-6.08.06 is the path where I build and install root, and /opt/root/root-6.08.06_install/ is the directory where I install root.
then I did this: make -j2
and this: sudo make install
It will effect only Math stuff in root.
Cheers
…Did you try it?
Cheers
yes (I had -D=All anyway) … And I get the same:
$ root
   -------------------------------------------------------------------------
  | Welcome to ROOT 6.08/07                             http://root.cern.ch |
  |                                            (c) 1995-2017, The ROOT Team |
  | Built for macosx64                                                      |
  | From heads/v6-08-00-patches@v6-08-06-68-gff9a7c0, May 22 2017, 13:00:39 |
  | Try '.help', '.demo', '.license', '.credits', '.quit'/'.q'              |
   -------------------------------------------------------------------------

root [0] .x BRHaalimitSetHigh_low_mass.C

Applying ATLAS style settings...

Error in <GSLError>: Error 4 in interp.c at 83 : x values must be strictly increasing
Warning in <ROOT::Math::GSLInterpolator::Eval>: input domain error
Warning in <ROOT::Math::GSLInterpolator::Eval>: input domain error
Warning in <ROOT::Math::GSLInterpolator::Eval>: input domain error
Warning in <ROOT::Math::GSLInterpolator::Eval>: input domain error
root [1]
As I said I let @moneta answer you.
Ok cool, let’s wait for him, I keep trying to find a solution meanwhile.
Thanks
Cheers
This topic was automatically closed 14 days after the last reply. New replies are no longer allowed.