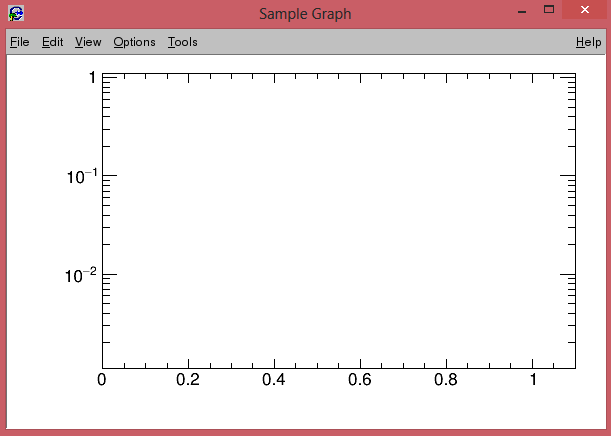
I have recently been trying to produce a graph in which the x-axis is linear and the y-axis is logarithmic. I have been able to produce a picture with linear axis. Here is my code;
{
Int_t n = 10;
float x[10] = { };
float y[10] = { };
TGraph *gr1 = new TGraph(n,x,y);
TCanvas *c1 = new TCanvas(“c1”,“Sample Graph”,200,10,600,400);
gr1->SetMarkerStyle(1);
gr1->SetLineWidth(2);
c1->cd(1);
gPad->SetLogy();
gr1->Draw();
}
What do I have to do to produce this graph with a logarithmic y-axis?
Thanks,
Liam