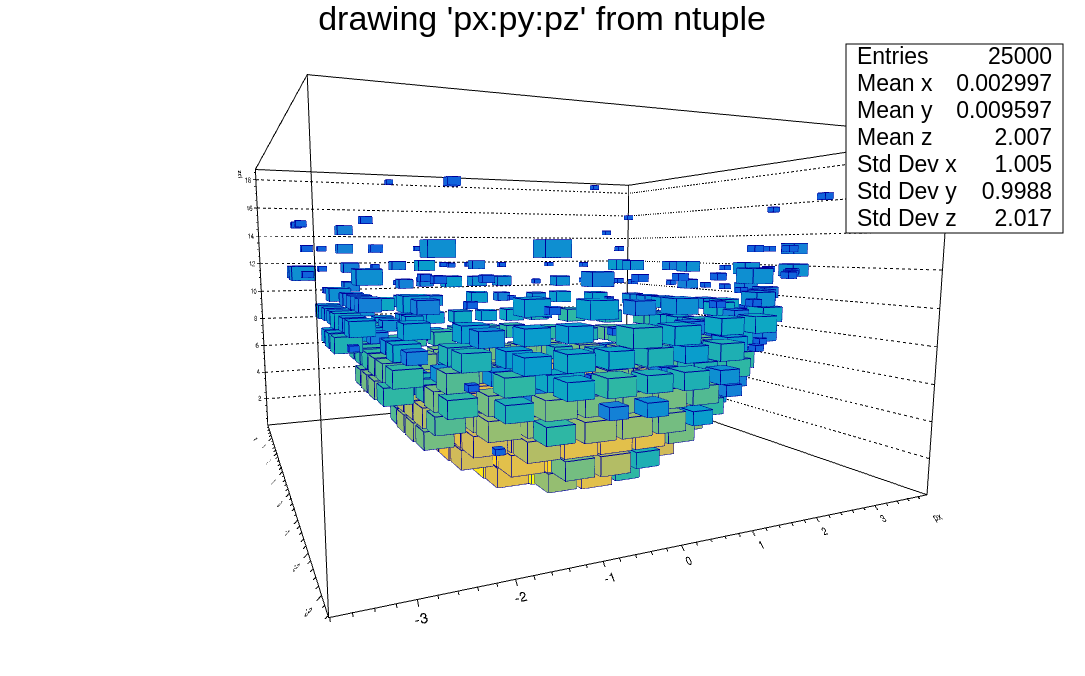
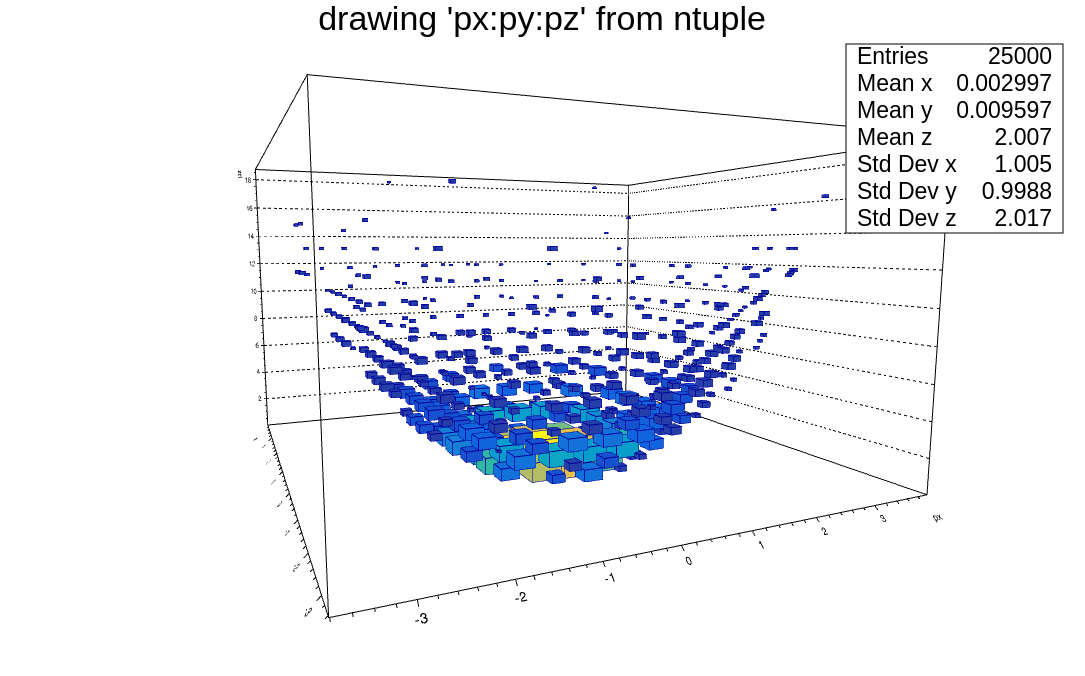
I would like to set logarithmic scale on the content of a 3D histogram (I am using “BOX2Z” draw option) without setting any of the three axes to logarithmic scale.
In case of a 2D histogram I can use gStyle->SetLogz(), but this is not possible in this case since it changes both the color palette and the z axis to logarithmic.
We have 4 different BOX options, ISO, and SCAT (even if it is deprecated). The new option will have to display the log of the content instead of the content itself. So all the options are concerned.