ROOT Version: Not Provided Platform: Not Provided Compiler: Not Provided
Dear All,
I am trying to plot a multi graph,
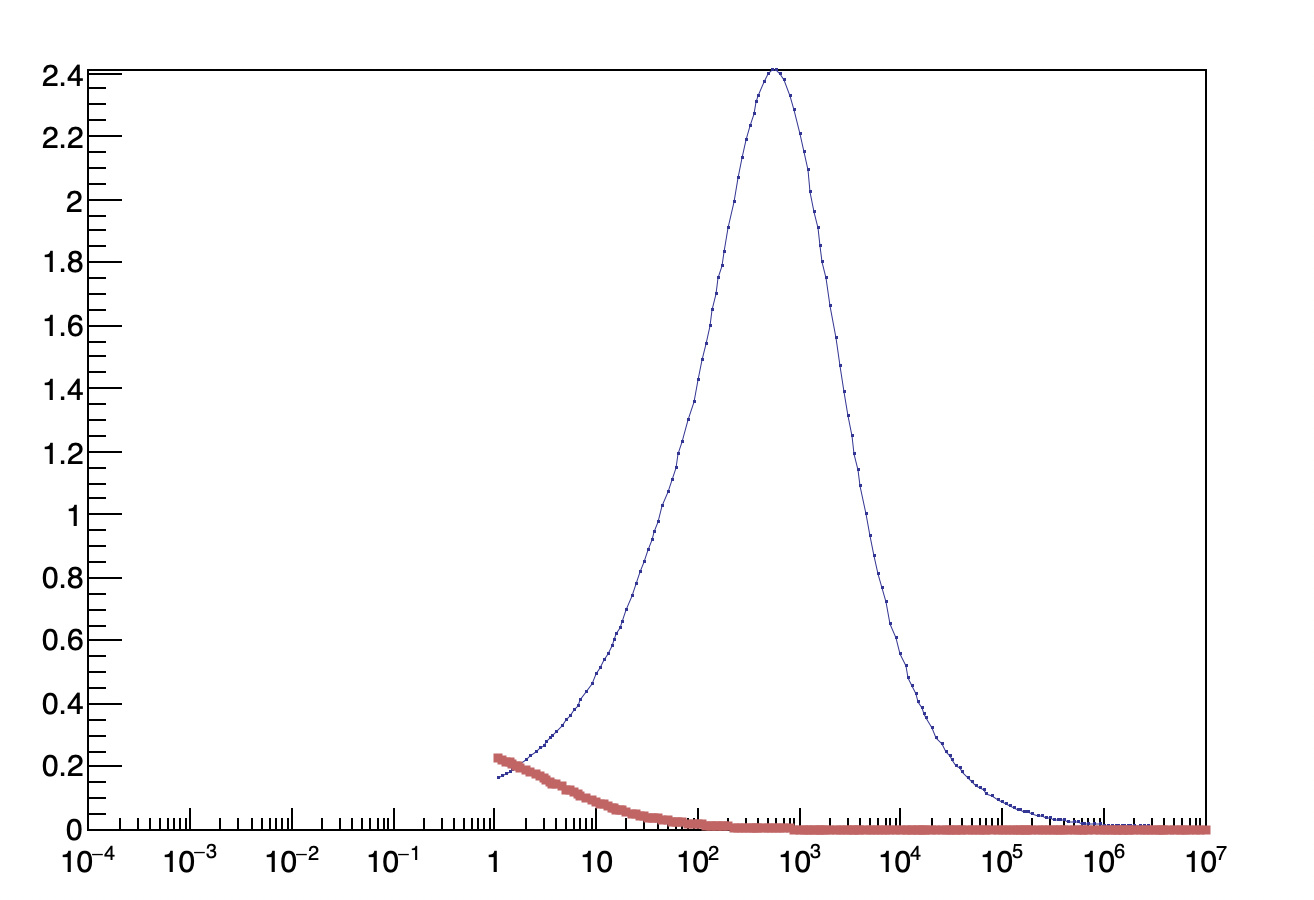
I start first with single graph, I plot the data file
auto gr1 = new TGraph(“energy_loss_electronic.dat”);
gr1->SetLineColor(kBlue-2);
gr1->SetMarkerStyle(7);
gr1->SetMarkerColor(kBlue-2);
gr1->SetMarkerSize(0.6);
gr1->Draw(“APL”);
after plotting the graph I took the log scale for x-axis using the Editor windows,
both the graph and the log scal are attached as (gr1 &gr1_log)
and because I am aiming to plot two graphs , I imposed the multigraph
    auto mg = new TMultiGraph();
auto gr1 = new TGraph("energy_loss_electronic.dat");
    mg->Add(gr1);
    mg->Draw("APL");
then I start to get strange values less than zero, and the log scale is not logic, I have attached the new graphs (mg &mg_log)
what is the difference between single graph and muligraph, when I edit the x-axis scale to log ? and How can overcome this issue
Thank you for helping, and I can see that it works with your macro perfectly. but if I tried to compile it , it give me Error
axis-> SetLimits(0.0,10000000); … illegal pointer to class object GetXaxis(),
I tried previously this option by using
mg->GetXaxis()-> SetLimits(0,10000000);
mg->GetYaxis()-> SetLimits(0,4);
but also did not work
can I know what is the explanation for obtaining values less than zero in case of multigraph??