Hi, sorry if this type of question has been posted many times before, but I’m not even sure what keywords to use to search for the answer!
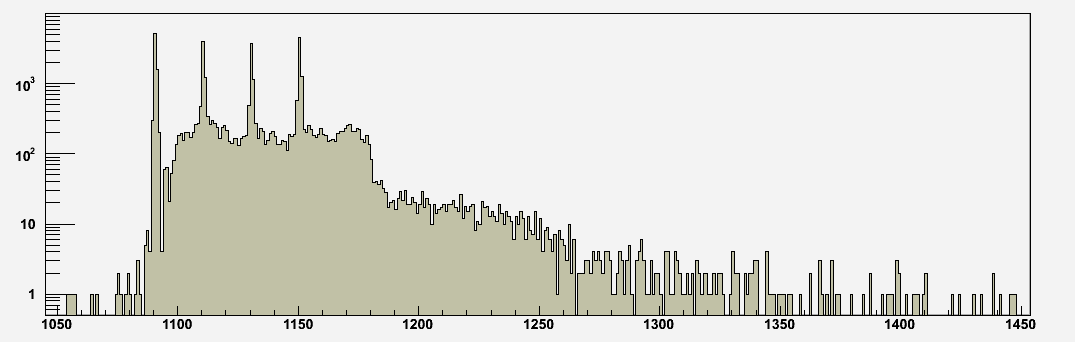
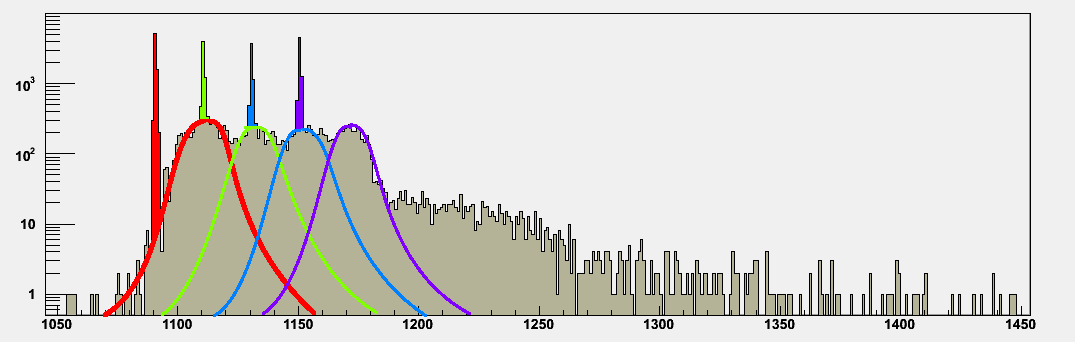
I have some histograms of trigger timings which suggest there is some kind of “gaussian” shaped distribution following each bunch. The attachment shows my histogram with the gaussian shape drawn on ‘by hand’. Note, it is a logY plot, so strictly speaking the distribution is a log-normal! But that’s not really important!
The problem is, in most data sets, like ‘HI_10Nov_Late_log-norm.png’, I can only discern the very top of the ‘gaussian’ peak. Is it possible to make a fit to these small peaks.
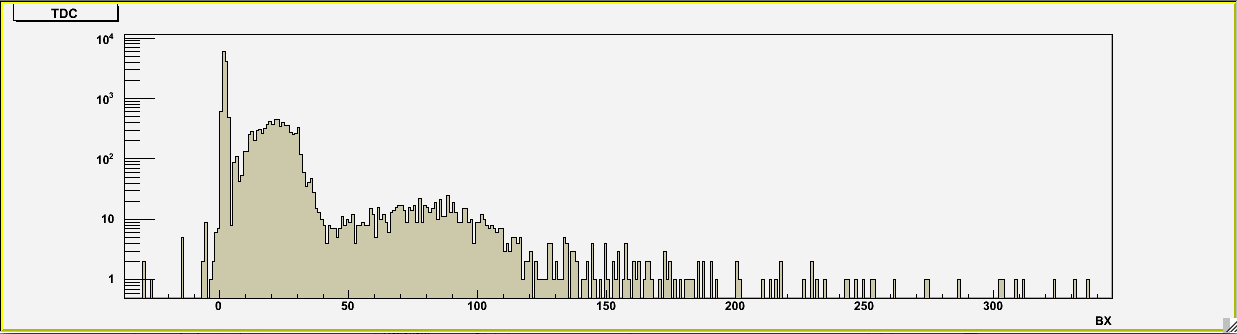
I’ve also attached a data set where you can clearly see the trailing peak (centred at BX = 20).
If someone could give me directions to the relevant tutorials & documentation, it would be very much appreciated.
A.