faca87
January 14, 2021, 1:01pm
1
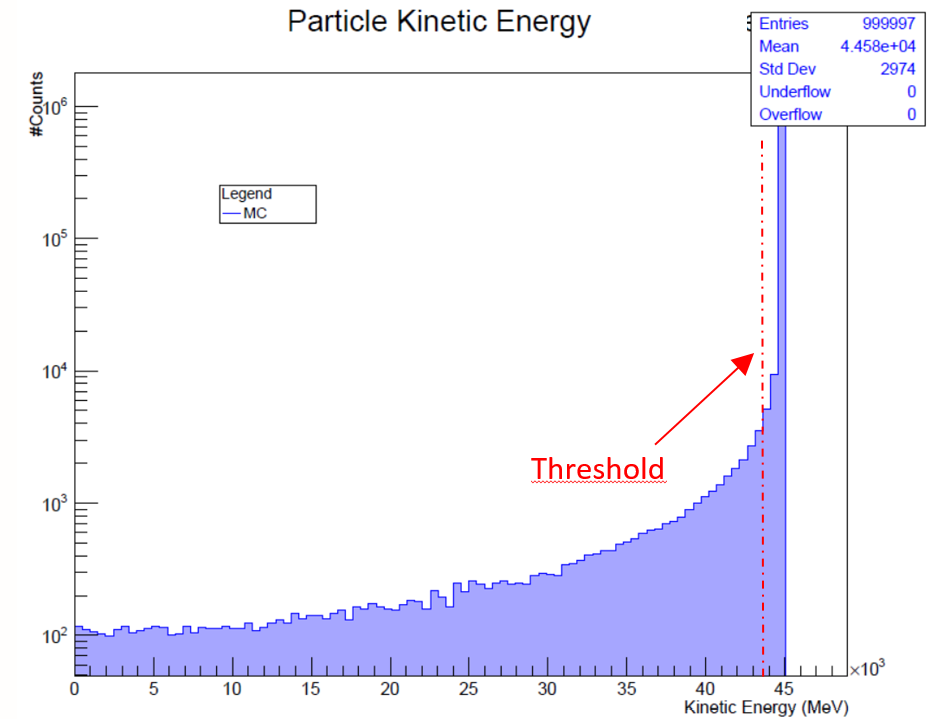
Hello I’m plotting the kinetic energy of simulated primary e+ outgoing my targets …given that I’m studying the e+e- ->mu+mu- (the threshold of this interaction is E=43.69GeV) interaction, I want to know how many e+ of the beam over threshold I’ve afeter the target then I’m calculating the e+_E>=43.69 / e+total
I’m doing a power point presentation and I painted (by powerpoint) a threshold line
obviously i can’t put the line at exactly E=43.69GeV by power point. Is there a way to do it by ROOT so it will be at exactly energy?
Please read tips for efficient and successful posting and posting code
ROOT Version: Not ProvidedPlatform: Not ProvidedCompiler: Not Provided
You can plot a TLine after plotting the histogram, like this
float threshold = 43.69;
auto lnThreshold = new TLine(threshold, 0, threshold, gPad->GetUymax());
lnThreshold->SetLineColor(kRed);
lnThreshold->SetLineStyle(10);
lnThreshold->SetLineWidth(2);  // maybe
lnThreshold->Draw();
Since the y axis is logarithmic, have a look into this topic on how to correctly draw the line all the way to the top of the pad.
A TText object can be used to draw the word “threshold” in the plot.
faca87
January 14, 2021, 5:54pm
3
Hello @jblomer thank you for you reply. I tried your code…it works fine for a linear scale but not for a logartimic one (as you wrote).@couet ’s code because I need a logaritmic scale but I can’t do it…
I added the function
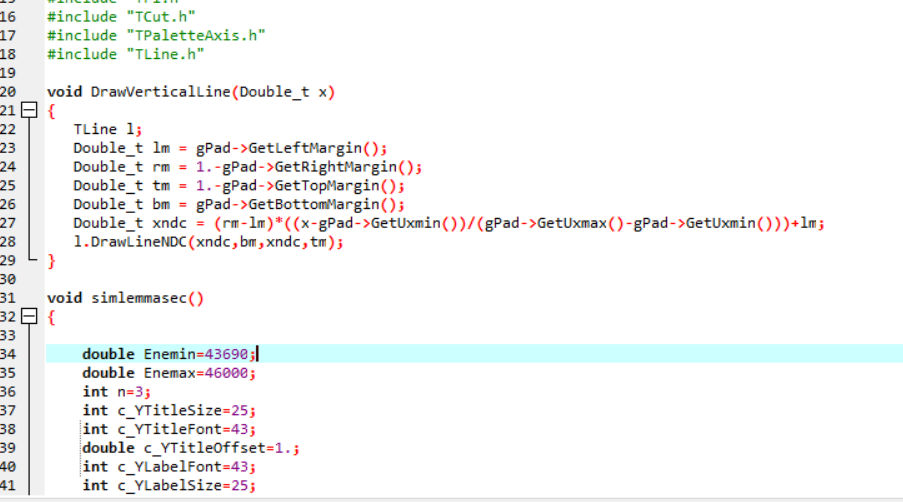
void DrawVerticalLine(Double_t x)
{
   TLine l;
   Double_t lm = gPad->GetLeftMargin();
   Double_t rm = 1.-gPad->GetRightMargin();
   Double_t tm = 1.-gPad->GetTopMargin();
   Double_t bm = gPad->GetBottomMargin();
   Double_t xndc = (rm-lm)*((x-gPad->GetUxmin())/(gPad->GetUxmax()-gPad->GetUxmin()))+lm;
   l.DrawLineNDC(xndc,bm,xndc,tm);
}
at the beginning of my macro
then In my plot I added the lines
DrawVerticalLine(2.);
   c21->SetLogy();
i.e. this is the plot
	TCanvas *c21 = new TCanvas("c21",canvtitle,1280,1024);
			ts->Draw(Form("SecondaryParticleKinEn >> htemp(100, 0., 0.)"));
 			ts->GetHistogram()->SetTitle("Primary e^{+} Kinetic Energy");
 			ts->SetScanField(0);
  	 		TH1F *htempkinensp= (TH1F*)gPad->GetPrimitive("htemp");
  			htempkinensp->GetXaxis()->SetTitle(kinenxname);
			htempkinensp->GetYaxis()->SetTitle(countyname);
			htempkinensp->GetYaxis()->SetTitleSize(c_YTitleSize);
  			htempkinensp->GetYaxis()->SetTitleFont(c_YTitleFont);
   			htempkinensp->GetYaxis()->SetTitleOffset(c_YTitleOffset);
   			htempkinensp->GetYaxis()->SetLabelFont(c_YLabelFont);
   			htempkinensp->GetYaxis()->SetLabelSize(c_YLabelSize);
   			htempkinensp->GetXaxis()->SetTitleSize(c_XTitleSize);
   			htempkinensp->GetXaxis()->SetTitleFont(c_XTitleFont);
   			htempkinensp->GetXaxis()->SetTitleOffset(c_XTitleOffset);
   			htempkinensp->GetXaxis()->SetLabelFont(c_XLabelFont);
   			htempkinensp->GetXaxis()->SetLabelSize(c_XLabelSize);
   			htempkinensp->SetFillStyle(1001);
   			htempkinensp->SetFillColorAlpha(kBlue, fillcolor);
	   		htempkinensp->Draw();
	   		htempkinensp->SetName(htempname);
	   		gPad->Modified();
			gPad->Update(); // make sure it's really (re)drawn
   			c21->Update();
			DrawVerticalLine(2.);
   			c21->SetLogy();
			gPad->Modified();
			gPad->Update(); // make sure it's really (re)drawn
   			c21->Update();
   			TLegend* legkinensp = new TLegend(0.25, 0.7, .35, .75);
   			legkinensp->SetHeader("Legend");
  			legkinensp->SetNColumns(1);
   			legkinensp->AddEntry(htempkinensp, "MC", "l");
   			legkinensp->Draw();
   			c21->Update();
   			gPad->Modified();
			gPad->Update();
			TPaveStats *statskinensp = (TPaveStats*)htempkinensp->GetListOfFunctions()->FindObject("stats");
			statskinensp->SetTextColor(kBlue);
			statskinensp->SetX1NDC(0.80); statskinensp->SetX2NDC(0.98);
			statskinensp->SetY1NDC(0.83); statskinensp->SetY2NDC(0.98);
			statskinensp->DrawClone();
			gPad->Update();
			c21->Print(myplotkinensp);
			delete c21;
but when I run the macro I don’t get the line
If possible, please attach the full macro, I’d like to try to reproduce.
faca87
January 15, 2021, 10:32am
5
Hello @jblomer sorry…yesterday I didnt’ understand that I had to use both your and @couet ’s code!
Today I tried to add your code too and it worked fine!
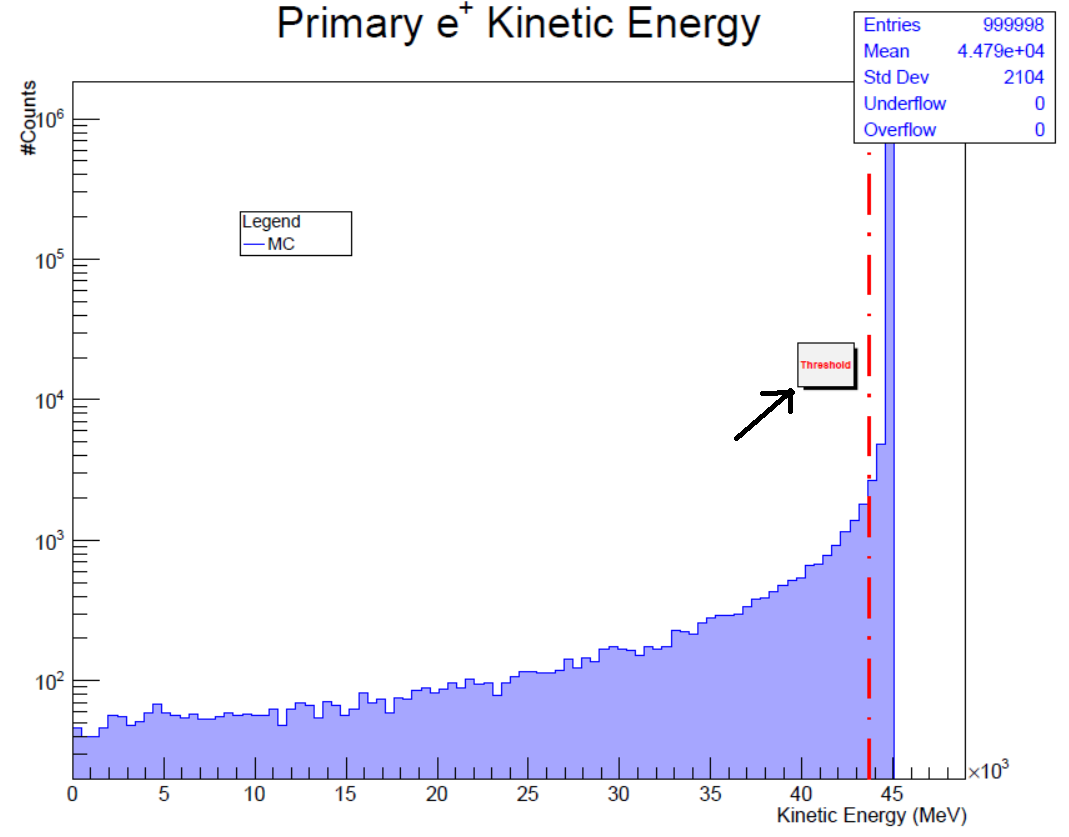
Last question please. I’m trying to add the word “Threshold”
I can do it by the code
TPaveText *t=new TPaveText(0.8,0.6,0.85,0.55,"brNDC");
t->AddText("Threshold");
			((TText*)t->GetListOfLines()->Last())->SetTextColor(kRed);
  			t->Draw();
but I get a background for the TText… instead I want a transparent background …
Looking the page https://root.cern.ch/doc/master/classTPaveText.html it has this no trasparent background too…
This is the macro simlemmasec.cpp (53.3 KB)
it’ s long but this plot is the TCanvas *c21 = new TCanvas("c21",canvtitle,1280,1024);
i.e. lines 260-317
jblomer
January 15, 2021, 11:00am
6
You can use a TText instead of a TPaveText to remove the background. You can adjust size, color, and so on as described here: https://root.cern.ch/doc/master/classTText.html
faca87
January 15, 2021, 11:08am
7
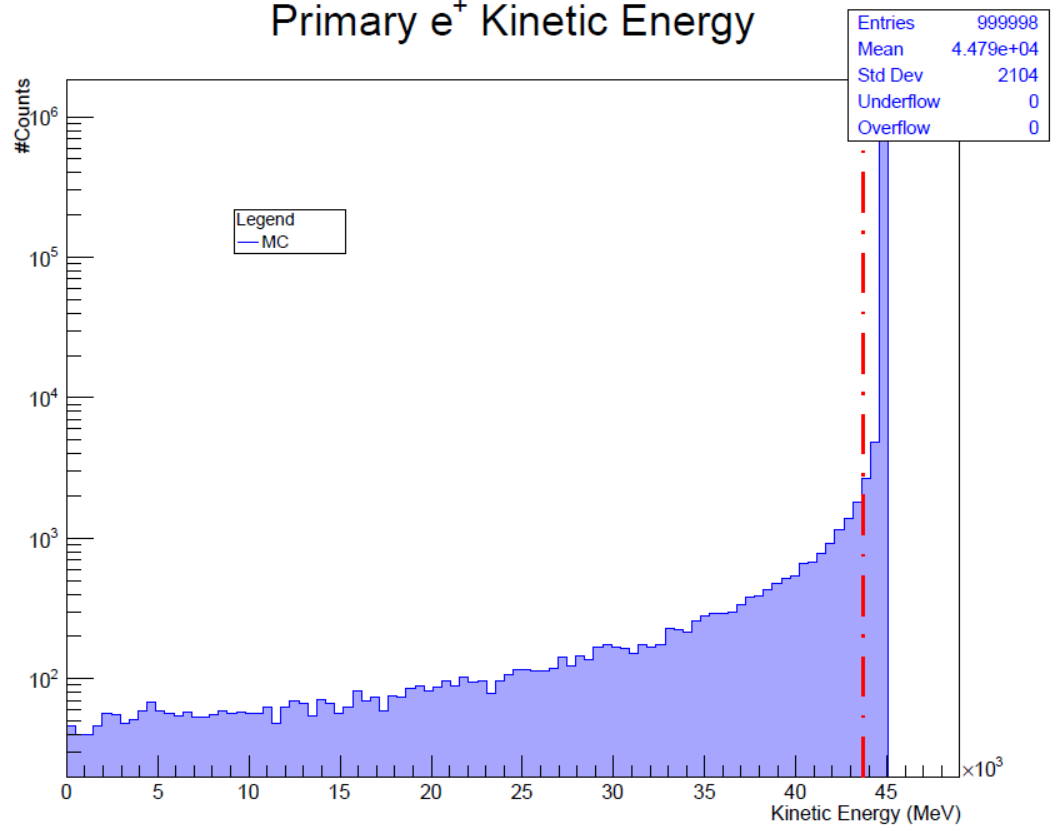
Hello @jblomer actually, before writing my previous message, I also tried the TText …but If I use it, I dont’ get any written
That’s because I tried the TPaveText
 TCanvas *c21 = new TCanvas("c21",canvtitle,1280,1024);
			ts->Draw(Form("SecondaryParticleKinEn >> htemp(100, 0., 0.)"));
 			ts->GetHistogram()->SetTitle("Primary e^{+} Kinetic Energy");
 		//	TPaveText *t=new TPaveText(0.75,0.6,0.8,0.55,"brNDC");
 			ts->SetScanField(0);
  	 		TH1F *htempkinensp= (TH1F*)gPad->GetPrimitive("htemp");
  			htempkinensp->GetXaxis()->SetTitle(kinenxname);
			htempkinensp->GetYaxis()->SetTitle(countyname);
			htempkinensp->GetYaxis()->SetTitleSize(c_YTitleSize);
  			htempkinensp->GetYaxis()->SetTitleFont(c_YTitleFont);
   			htempkinensp->GetYaxis()->SetTitleOffset(c_YTitleOffset);
   			htempkinensp->GetYaxis()->SetLabelFont(c_YLabelFont);
   			htempkinensp->GetYaxis()->SetLabelSize(c_YLabelSize);
   			htempkinensp->GetXaxis()->SetTitleSize(c_XTitleSize);
   			htempkinensp->GetXaxis()->SetTitleFont(c_XTitleFont);
   			htempkinensp->GetXaxis()->SetTitleOffset(c_XTitleOffset);
   			htempkinensp->GetXaxis()->SetLabelFont(c_XLabelFont);
   			htempkinensp->GetXaxis()->SetLabelSize(c_XLabelSize);
   			Double_t integral= htempkinensp->Integral(0,45);
   			htempkinensp->SetFillStyle(1001);
   			htempkinensp->SetFillColorAlpha(kBlue, fillcolor);
	   		htempkinensp->Draw();
	   		htempkinensp->SetName(htempname);
	   		gPad->Modified();
			gPad->Update(); // make sure it's really (re)drawn
   			c21->Update();
   			float threshold = 43690;
			auto lnThreshold = new TLine(threshold, 0, threshold, gPad->GetUymax());
			lnThreshold->SetLineColor(kRed);
			lnThreshold->SetLineStyle(10);
			lnThreshold->SetLineWidth(2);  // maybe
			lnThreshold->Draw();
			DrawVerticalLine(2.);
   			c21->SetLogy();
			gPad->Modified();
			gPad->Update(); // make sure it's really (re)drawn
   			c21->Update();
   			TLegend* legkinensp = new TLegend(0.25, 0.7, .35, .75);
   			legkinensp->SetHeader("Legend");
  			legkinensp->SetNColumns(1);
   			legkinensp->AddEntry(htempkinensp, "MC", "l");
   			legkinensp->Draw();
   			c21->Update();
   			gPad->Modified();
			gPad->Update();
			TPaveStats *statskinensp = (TPaveStats*)htempkinensp->GetListOfFunctions()->FindObject("stats");
			statskinensp->SetTextColor(kBlue);
			statskinensp->SetX1NDC(0.80); statskinensp->SetX2NDC(0.98);
			statskinensp->SetY1NDC(0.83); statskinensp->SetY2NDC(0.98);
			//statskinensp->AddText(TString::Format("Integral	= %g", integral));
			statskinensp->DrawClone();
			gPad->Update();
   			//t->AddText("Threshold");
			//((TText*)t->GetListOfLines()->Last())->SetTextColor(kRed);
  			//t->Draw();
  			TText *t = new TText(.75,.8,"Threshold");
   			t->SetTextAlign(22);
   			t->SetTextColor(kRed+2);
   			t->SetTextFont(43);
   			t->SetTextSize(40);
   			t->SetTextAngle(45);
		   	t->Draw();
			gPad->Update();
			c21->Print(myplotkinensp);
			delete c21;
simlemmasec.cpp (53.5 KB)
This is one root file https://we.tl/t-SxuLjncEZl
faca87
January 15, 2021, 11:48am
9
Thank you @Wile_E_Coyote ! it worked