Dear experts,
I wonder if there is a way to define a signal histogram with a shape depending on some RooRealVars in RooFit. To clarify, I don’t think histogram morphing is the solution I’m looking for.
Here’s the context: I’m in the process of calibrating a detector by fitting experimental data to a histogram generated from Monte Carlo (MC) simulations. The experimental data is in arbitrary units, while the MC simulations are in energy units. I do recognize that a portion of the simulation histogram aligns with my data, but the exact calibration values are unknown. My goal is to determine both the calibration values and their uncertainties through the fitting process.
In essence, I want the likelihood to identify a segment of the MC spectrum that best matches my experimental data. Specifically, I know that the detector response should follow the form detector_response = A * energy + B, and I want to find the values of A and B through the best fit.
I was thinking of using a likelihood similar to the Barlow Beeston but with two additional unknowns for calibration. During minimization, these calibration parameters would adjust the scale of the Monte Carlo events, creating a new histogram based on the events that fall within the experimental data window. So, I’m curious to know if it’s possible to set up the signal histogram so that it relies on the calibration parameters (A, B) within the likelihood.
There are several ways to do this in RooFit. In the simplest case you model your signal function starting from a RooHistPdf or RooHistFunc if it does not need to be normalised, which describes the MC simulations. The Barlow-Beeston approach should be used in case you have several MC components and in addition the procedure is not correct if you are doing an extended likelihood fit where the total number of events fluctuates.
@moneta
Thanks, if I understood both RooHistPdf and RooHistFunc require a fixed shape underlying histogram but I don’t know that before a calibration. For the calibration, I don’t exactly know which interval of the MC data matches the shape of my experiment data. So, the minimizer should be able to search through different intervals to find the best matching one. For this, I thought I would need to dynamically make RooHistPdf objects during the minimization while scanning different MC intervals. The calibration function guides the minimizer in transitioning between intervals.
True, I also have a PDF with empirical background data that I didn’t mention. It’s easy to include that because it shares units with my calibration data.
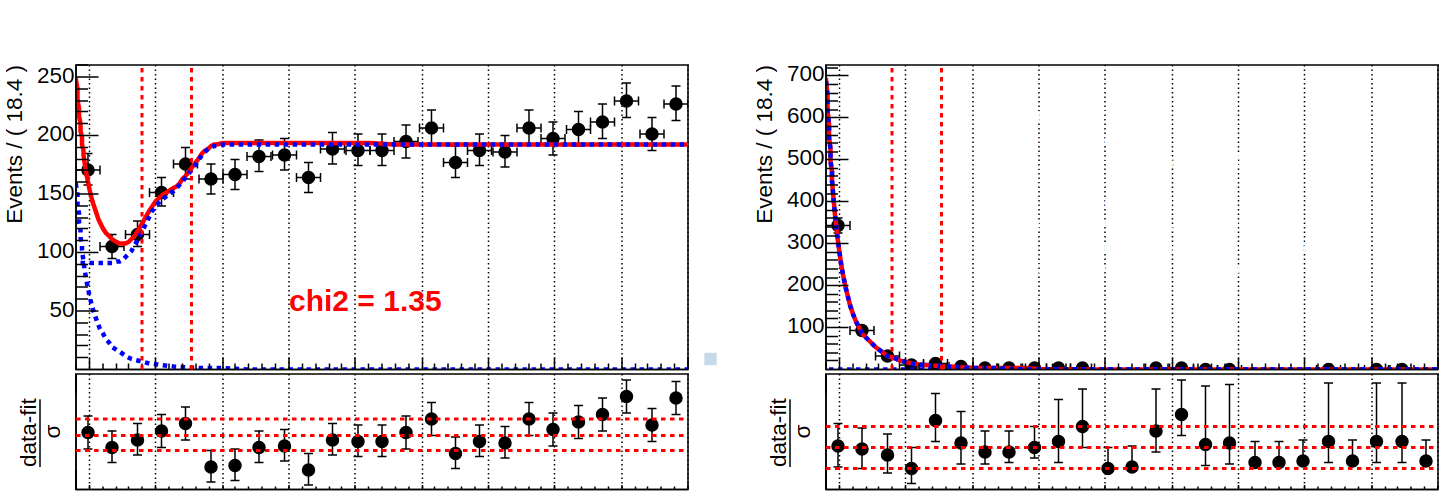
For instance, I have the pseudo background data on the right and pseudo calibration data on the left. Currently, I use a basic analytical model to fit the calibration data. However, I was hoping to let the minimizer determine which part of the Monte Carlo simulation fits my data best. Again, the unit of x-axis for the data is not known, and so is the matching interval with the MC simulations.