delick
September 23, 2023, 11:31am
1
I was using root version 6.28/04 and I use the following code to draw likelihood contours:
RooPlot* frame = minuit_hf->contour( * etap_var , * V20_var);
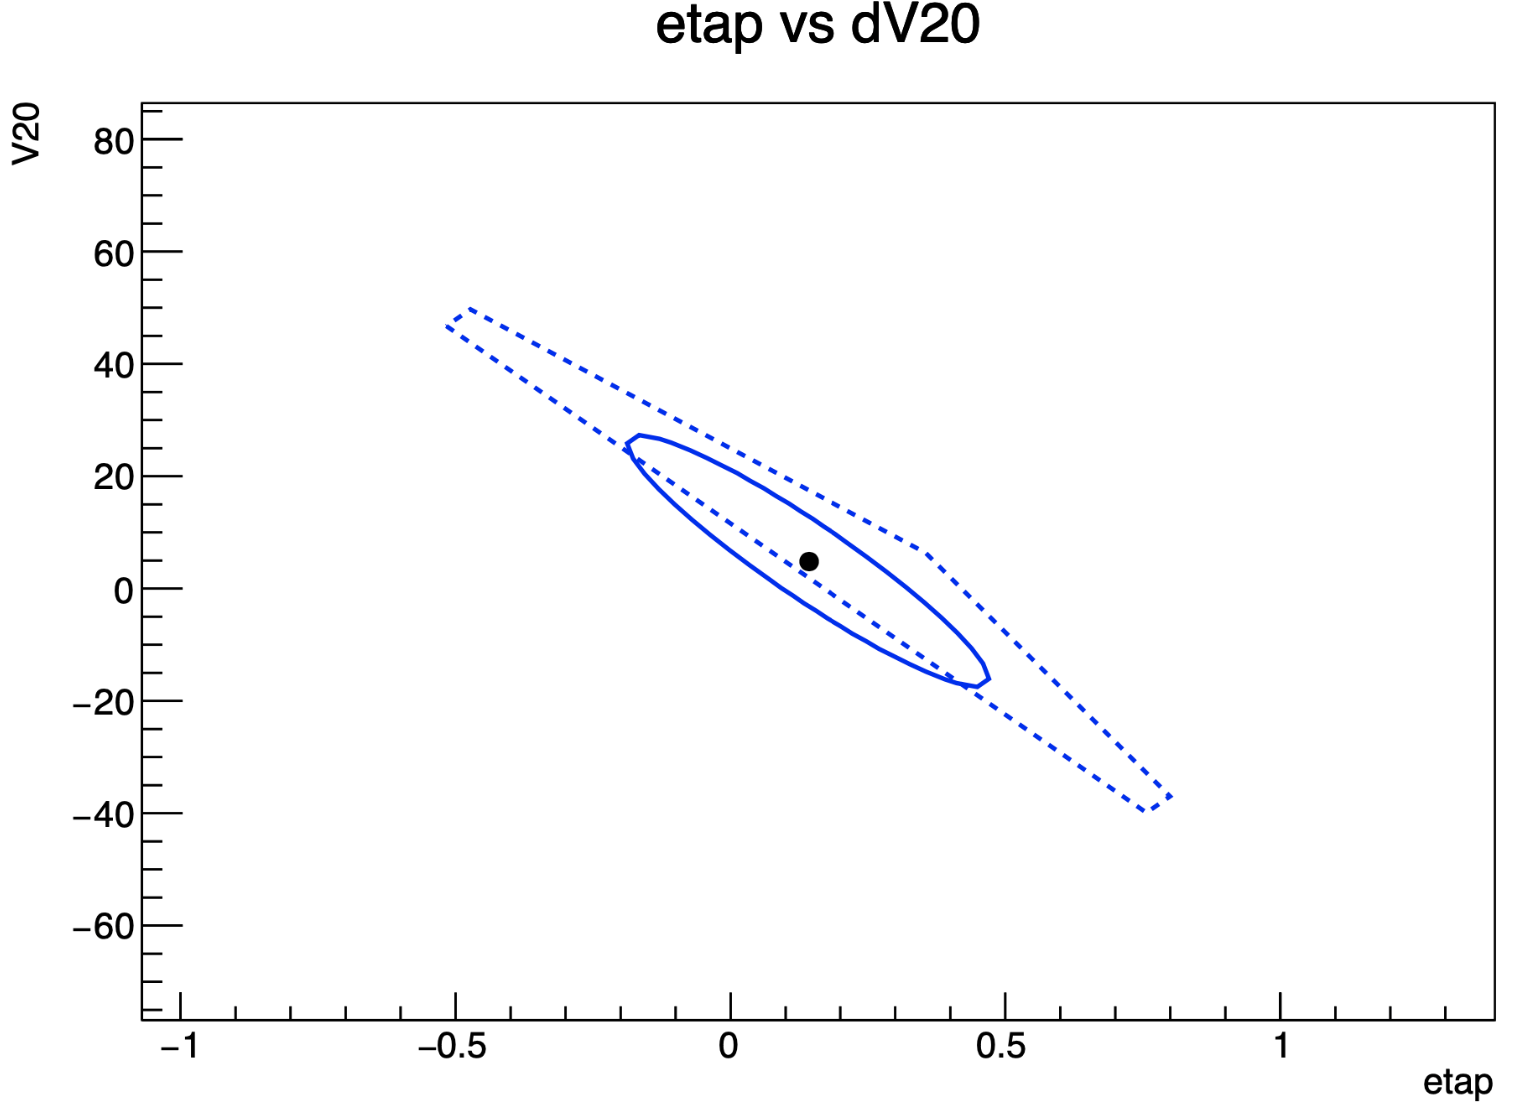
frame->SetTitle( "etap vs dV20" );
frame->SetAxisRange( etap_var->getValV() - 3.0 * etap_var->getError() , etap_var->getValV() + 3.0 * etap_var->getError() , "X" );
frame->SetAxisRange( V20_var->getValV() - 3.0 * V20_var->getError() , V20_var->getValV() + 3.0 * V20_var->getError() , "Y" );
frame->Draw();
It gave me the following contours, in which the 1-sigma and 2-sigma contours intersect. How do I solve this problem?
Danilo
September 24, 2023, 1:19pm
2
Hi,
Thanks for posting. This is not necessarily an artifact of the plot, but could be resulting from an ill-behaved fit.
Best,
jonas
September 26, 2023, 10:22pm
3
Hello @delick !
Are you using Minuit2? The contour algorithm is known to be buggy with Minuit2:
opened 09:39PM - 26 Sep 23 UTC
bug
in:Math Libraries
I the [RooFit interactive Minuit tutorial](https://root.cern.ch/doc/master/rf601… __intminuit_8C.html), there is this line here:
```c++
// The contour algorithm in Minuit2 does not work for this tutorial
m.setMinimizerType("Minuit");
```
The implementation of `CONTOUR` in Minuit2 should be fixed such that this is not necessary.
The problem has something to do with the contours hitting the parameter boundaries.
If one tries to get different contours inside the boundary by changing the `contour()` to for example:
```c++
RooPlot *frame = m.contour(frac, sigma_g2, 1, 1.4, 1.7);
```
the plot looks still a bit screwed up with out-of-place lines:

Also this problem should be fixed.
Cheers,