I have a TStack on top of which I want to draw some points with errors bars (TH1F) and then draw a TLegend.
The stack, legend, and data hist all get made a head of time and are returned other functions. Then I create a new canvas and draw each of them in turn:
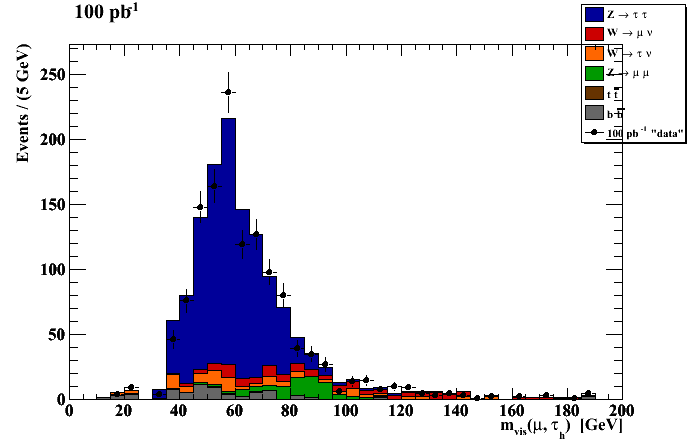
But, unforunately the legend is drawn over by the axis. I am certain that the legend’s fill style is solid and not hollow. You can also tell by the tick marks, that the axis is indeed drawn over the legend labels. See attached figure.
I’ve tried to insert a legend.Pop() command before or after the Draw, with no effect. If I do not Draw the fake_data_hist and only draw the stack, then there is no problem. Any ideas what is wrong? Thanks the help.
In my real script, I collect the histograms from several root files, and then format them in functions. But to help you debug, I have created a simplified script that creates histograms at random and gives the same behavior.
I include a rootlogon.py file, and I believe I’ve found that the lines
are the ones causing the trouble. Also, note that if I comment out the fake_data_hist.Draw call, the problem goes away. Attached are my script, my rootlogon.py, and the output figure.
I’ve also had a problem with pad ticks before when I have string bin labels. For some reason, setting the ticks on puts the bin labels on both sides of the plot. See attached.
Finally, note that if you import my rootlogon.py, something is causing the white histogram to be drawn as light blue.
Yes, I appologize. I sent you the version of the script where my histograms are drawn by another module and returned.
I have made a simplified version of the script that, generates random histograms, so you don’t need my data or other modules. It is attached.
I see the bug, that the legend is drawn over by the axis in ROOT 5.22, but if I switch to ROOT 5.20, the problem goes away. Could you confirm?
For the ease of reading it on the forum, the script is also here:
#!/usr/bin/env python
#------------------------------------------------------------------------------
import sys
if not sys.argv.count('-i') and not sys.argv.count('-b'):
sys.argv.append('-b')
import ROOT
#import rootlogon
ROOT.gStyle.SetPadTickX(1)
ROOT.gStyle.SetPadTickY(1)
#----------------------------------------------
# create some random histograms
#----------------------------------------------
rand2 = ROOT.TRandom()
hists = []
for i in xrange(4):
h = ROOT.TH1F('h%s' % i, '', 40, 0., 200.)
for j in xrange(100):
h.Fill(rand2.Gaus(80, 30), rand2.Poisson(6-i))
hists.append(h)
#----------------------------------------------------------
# create stack and legend
#----------------------------------------------------------
stack = ROOT.THStack('fake_data_stack', '100 pb^{-1}')
for i, h in enumerate(hists):
h.SetFillColor(i)
h.SetStats(0)
stack.Add(h)
legend = ROOT.TLegend(0.7, 0.6, 0.99, 0.99)
for i, h in enumerate(hists):
legend.AddEntry(h, str(i), 'F')
#----------------------------------------------------------
# create data points by drawing randomly from sum of stack
#----------------------------------------------------------
nbins = hists[0].GetNbinsX()
fake_data_hist = ROOT.TH1F('fake_data_hist', '', 40, 0., 200.)
fake_data_hist.SetStats(0)
rand = ROOT.TRandom()
for i in xrange(nbins):
y = 0.0
for h in hists:
y += h.GetBinContent(i+1)
fake_data_hist.Fill(hists[0].GetBinCenter(i+1), rand.Poisson(y))
#----------------------------------------------------------
# draw and save
#----------------------------------------------------------
canvas = ROOT.TCanvas('can')
stack.Draw('hist')
fake_data_hist.Draw('sameAEPZ')
legend.AddEntry(fake_data_hist, '100 pb^{-1} \"data\"', 'LP')
legend.Draw()
canvas.Update()
canvas.SaveAs('%s.eps' % 'fake_data')
canvas.SaveAs('%s.png' % 'fake_data')
I have not checked that yet. But it might be an axis redrawing added to redisplay correctly the axis when the option same is used. So, going backward might not be possible… I do not know … I need to check.
Is it a big deal for you to move the Legend ?
Having the legend in the top right, for many plots is best such that it obscures as little as possible. If there is something that changed between 5.20 and 5.22 that could be fixed, that would be nice.
In fact this effect was introduced by this fix: root.cern.ch/viewvc?view=rev&revision=25536
But If I reverse it, the problem it is fixing is reintroduced.
A fix applying for both problem should be found.