I’m trying to plot a TGraph2D (using ROOT version 6.06/06), using the code below:
 TGraph2D * Graph = new TGraph2D(nPoints, x, y , z);

 TCanvas * c1 = new TCanvas("c1","",900,700);

 gStyle->SetOptStat(0);
 gStyle->SetPalette(kBlueRedYellow );
 gStyle->SetNumberContours(90);

 tempGainNoise->GetXaxis()->SetTitle("X title");
 tempGainNoise->GetYaxis()->SetTitle("Y title");

tempGainNoise->GetXaxis()->SetLabelFont(42);
tempGainNoise->GetYaxis()->SetLabelFont(42);
tempGainNoise->GetZaxis()->SetLabelFont(42);

tempGainNoise->GetXaxis()->SetTitleFont(42);
tempGainNoise->GetYaxis()->SetTitleFont(42);

tempGainNoise->Draw("surf1");
This produces the following:
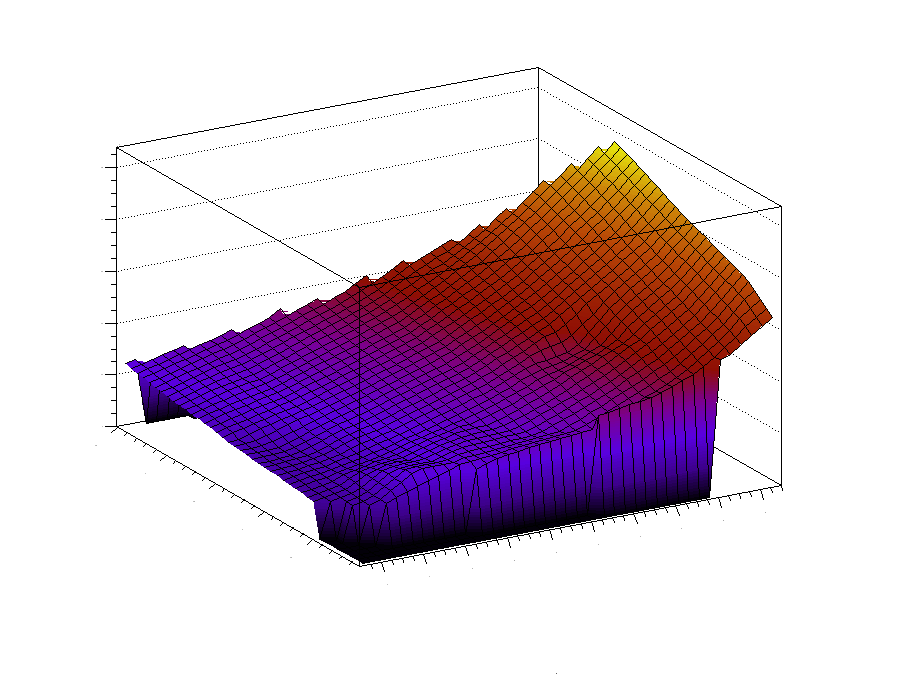
Whilst the colours are lovely, the axis labels and titles are reduced to tiny grey dots. Is there some difference with the way TGraph2D is drawn that explains this?
