Dear all,
I have fitting curve plotted on a canvas and I need to label the points by which the fitting curve pass throw.
Do you know how to do it in root?
I have also to label points in a spectrum.
Thank you
Dear all,
I have fitting curve plotted on a canvas and I need to label the points by which the fitting curve pass throw.
Do you know how to do it in root?
I have also to label points in a spectrum.
Thank you
You mean drawing a text near some specific points ?
Ok. Do you have a macro drawing your spectrum ? I can try to modify it to do that.
Please refer to the code listed below.
void peaks(TH1F *h)// TH1F *h is your histogram
{
  Double_t *xpeaks=NULL, *ypeaks=NULL;
  TSpectrum s=new TSpectrum(500);
  Int_t nfound=s->Search(h,2,"",0.01); // 0.01 is threshold for peak search.
  TPolyMarker *pm=(TPolyMarker *)
    h->GetListOfFunctions()->FindObject("TPolyMarker");
  pm->SetMarkerStyle(32);
  pm->SetMarkerColor(kGreen);
  pm->SetMarkerSize(0.4);
  xpeaks=s->GetPositionX();
  ypeaks=s->GetPositionY();
  for(int j=0;j<nfound;j++) {
    TLatex *tex=new TLatex(xpeaks[j],ypeaks[j],Form("%.1f",xpeaks[j]));
    tex->SetTextFont(13);
    tex->SetTextSize(14);
    tex->SetTextAlign(12);
    tex->SetTextAngle(90);
    tex->SetTextColor(kRed);
    tex->Draw();
  }
}
I cannot run your macro … it is incomplete. But what you are doing seems correct. What do you get ?
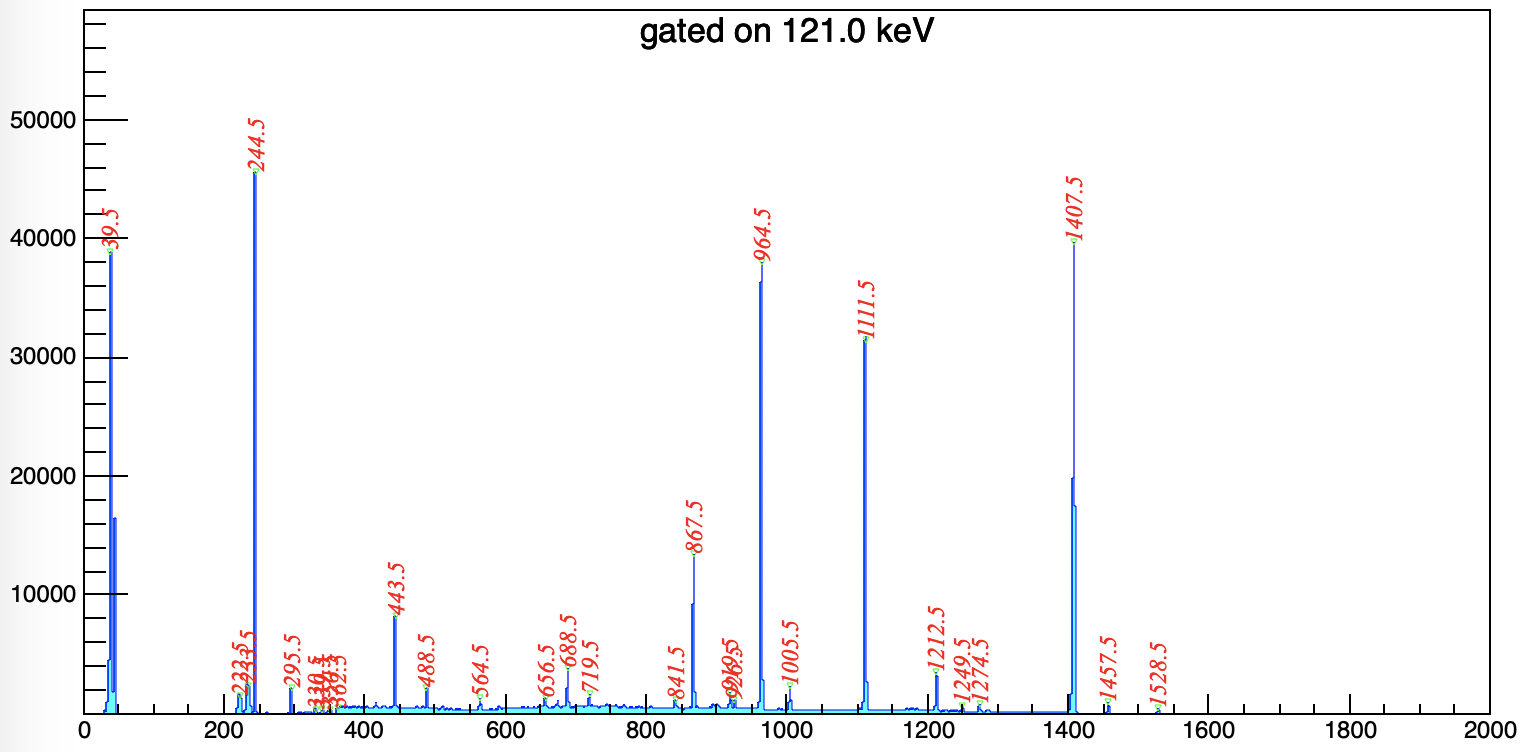
Here is a working example.
peakstext.C (1.2 KB)
yes running your macro produce the result I wanted thank you so much!
I modified the code, it should work.