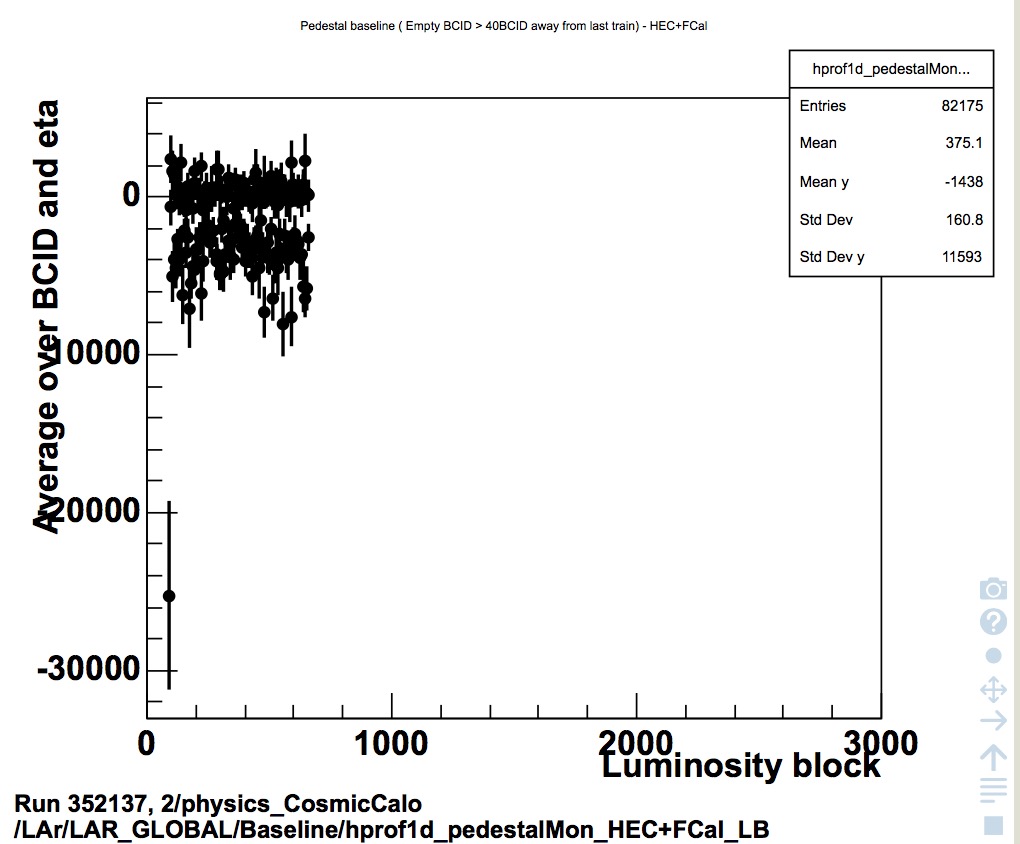
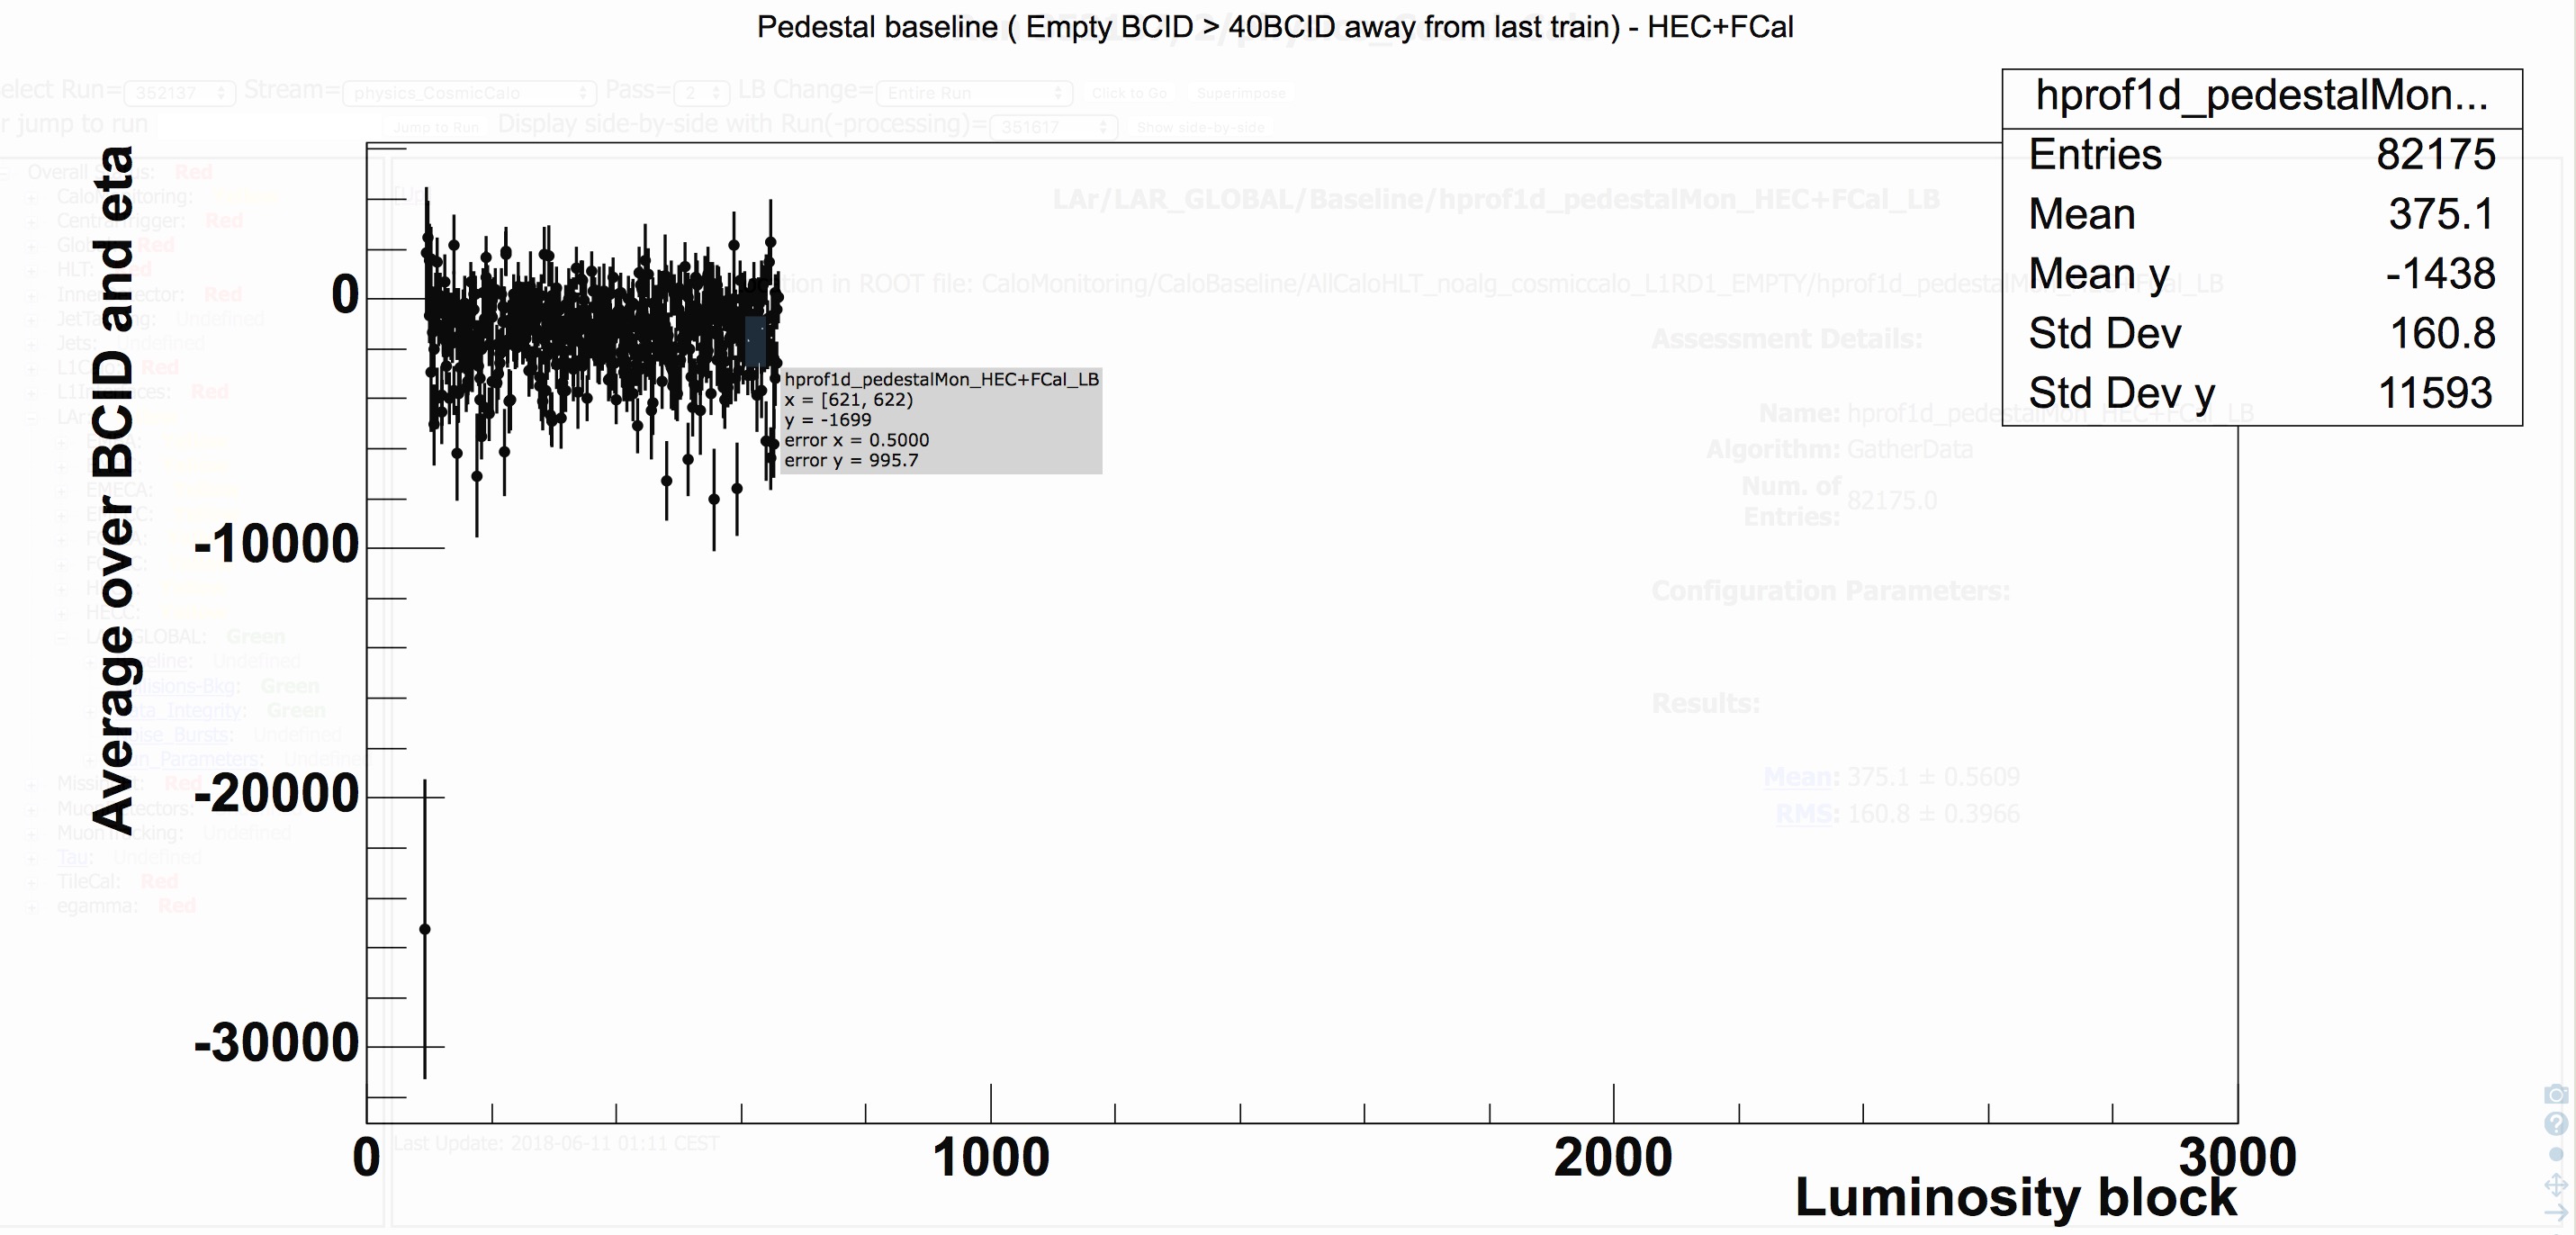
We are observing a situation where a data point is not displayed in jsROOT canvas. In this link (https://narayan.web.cern.ch/narayan/jsroot/) you can a PNG version as well as jsROOT version of the same canvas. One of the point on bottom left (which can be clearly seen in PNG plot) is not displayed in the jsROOT display. Can this be fixed
If you just zoom inside the range with missing point it will appear.
It is side effect of drawing optimization.
Not all points of histogram or profile are drawn when there are many of them.
Actually, this optimization algorithm is not correct when markers are drawn - same TProfile drawn with “hist” option looks reasonable.
It would be great if the optimization algorithm can handle the point as well correctly. Often (not in this particular case) we compare a nominal as well as a reference in these kind of plots, where the reference is draw with “HIST” option and the nominal is drawn as points. If we miss out the points, that would raise false alarm. We would really like the optimization algorithm to create an exception for these kind of situations
We see another issue after this fix. The points separate into bands depending on the zoom level of the plot. For example. These are the screenshots of the same plot at different Canvas Zoom level.
This is kind of intended behavior - JSROOT detects min/max values for each screen pixel and draw them.
All other points are discarded. Therefore displayed points depends from zooming factor.
Probably, I need to provide method to draw all points.
I made more logic in the code.
Now optimization will be used only when more than 50000 bins need to be drawn,
otherwise all markers and all error bars will be shown as is.