Dear ROOTers,
I’m currently using JSROOT to display a histogram in a web browser. The histogram is generated by a small section of python code executed by the webserver and passed as a JSON string to a JSROOT.redraw call
python:
hist = ROOT.TH2D("hist", blablablablabla)
for data in bufferToPlot:
    hist.Fill( data[0], data[1] )
jsonResp = ROOT.TBufferJSON.ConvertToJSON(hist)
return jsonResp #this goes back as POST response
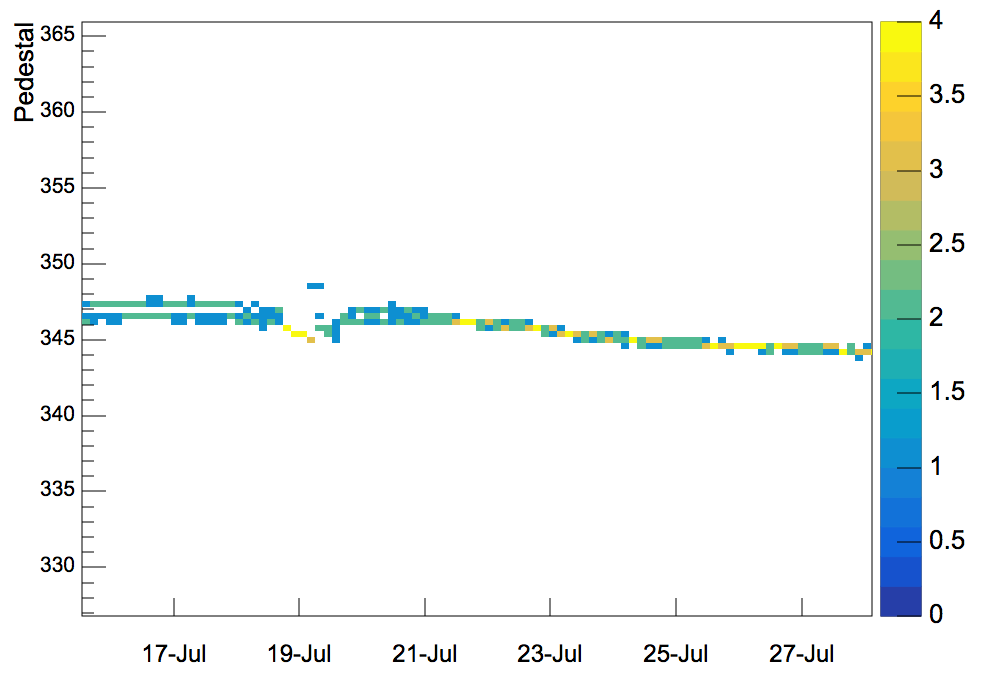
The problem I’m facing is that when I request the first plot everything is fine, then I zoom the y axis, and unzoom it, then request another plot, which will have a different y axis range, but in the browser window the y axis is still the first plot one (see attachment).
JSROOT.redraw() should be used if you intend to redraw same histogram preserving some interactive settings (like zoomed range). If you want to draw new histogram in the same div, just do:
btw, I’m having difficulties finding documentation for all the possible actions available in JSROOT. Can you point me in some general direction, if any?