Issues with my plots

Dear fellow Rooters,

I am fairly new to ROOT and so far like it a lot. However, during the last week I have tried to solve a couple of seemingly easy questions that I just cannot deal with. I have browsed this forum and the manual a LOT but just cannot find any answers, so I would kindly ask your advice and suggestions.

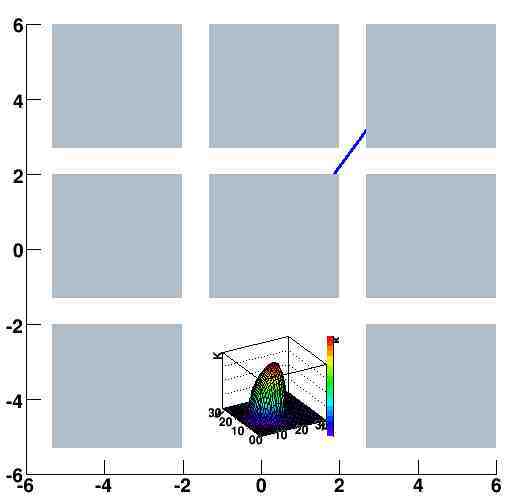
To simplify things, I am going to attach the code, an example data file and a picture of the plot. Here are my quesions:

1.) My TArrow-Object is in the background. However I would like to have the arrow from one pad to the other without being covered

2.) TPalette Axis: Is there any way to plot it horizontally instead of vertically? 2 years ago this questions was already posed before, so I just wanted to ask if anyone has tackled this in the meantime (http://root.cern.ch/phpBB2/viewtopic.php?t=6756&highlight=tpaletteaxis)

3.) This concerns the TPalette Axis again. Is there a way to have the labelling only there and not on the Z-Axis? (till now I am only to do both or none at the same time)

4.) This concerns the look of my plot. Usually I like the design of “surf1”, but on such a small scale it looks cramped. So I wondered if there was any way to influence the mesh-size

5.) Is there any way to remove the “Box” in which the graph is plotted?

6.) Since I am working on such a small scale, I haven´t found any Method to display the Axislabels properly. It either conflicts with the numbers or goes out of bounce via the SetLabelOffset … do you have any idea how to make solve this problem?

7.) Is there any way to rescale the plot directly? For example on the X-Axis the range [1,32] becomes the range [-1,1], without changing the look of the plot

8.) This is actually not so urgent but while I am at it I also want to ask it. I have read in a post before that there exists a “Trick” of how to variables as labels on a TGaxis, since normally this is not supposed to be possible ( http://root.cern.ch/root/roottalk/roottalk10/0011.html )… has anybody ever done that and could share some example-code?

I am aware that these are really a lot of questions, but I would appreciate any help, especially with 1,3,4,5,6 … thank you very much

with best regards,

Rafael
analyse_test.root (3.29 KB)
Mapping.txt (37.8 KB)

I will reply you questions (trying to modify your macro). Here are the answers to the easy ones:

I’ll check your macro

No

Put the labels away:
hpxpy->GetZaxis()->SetLabelOffset(999);
or do not draw the back box “surf1zbb”

Only by decreasing the number of bins.
Also try the option “surf2”

yes, options FB and BB look at the doc.

I am not sure what you mean here exactly …

You should recreate the histogram.

There is nothing to had to the post you are referring to. I am not sure I understand what you are looking for.

make a transparent pad on top of the another pad and draw the arrow9s) in it.

Dear couet,

thank you very much for your quick reply and helpful advices! Your suggestion with the transparent pad did the job!

thanks a lot, I somehow overread this part. In addition, is it also possible to remove the ZAxis?

[quote]Only by decreasing the number of bins.
Also try the option “surf2” [/quote]

Actually I have tried surf2 but I somehow like surf1 more. Thanks so much, SetNpx & SetNpy was what I was looking for!

[quote]
Quote:

6.) Since I am working on such a small scale, I haven´t found any Method to display the Axislabels properly. It either conflicts with the numbers or goes out of bounce via the SetLabelOffset … do you have any idea how to make solve this problem?

I am not sure what you mean here exactly … [/quote]

Actually I was referring to the label “x” and “y” that are both barely visible, because they are conflicting with the number “30” in my example … is there any method to move the “x” between the “20” and the “30” so that it becomes clearly visible?

[quote]Quote:

8.) This is actually not so urgent but while I am at it I also want to ask it. I have read in a post before that there exists a “Trick” of how to variables as labels on a TGaxis, since normally this is not supposed to be possible ( root.cern.ch/root/roottalk/roottalk10/0011.html )… has anybody ever done that and could share some example-code?

There is nothing to had to the post you are referring to. I am not sure I understand what you are looking for.[/quote]

I was just thinking about replacing the labels -6,-4,-2,0, etc. through characters, for example A,B,C,D,etc. in a TGaxis object. Is there any method to do this?

Thanks again for your time,
Rafael

again it is in the doc. Option “A”:
root.cern.ch/root/html/THistPainter.html#HP01c

The only way it to change the label offset and the label size.
Ultimately if you are still not satisfied you can suppress the label and draw yourself a text where you want.

As said in the post you were referring to, the A, B, C, D labels are available only via TAxis.

thanks again couet for your quick reply and the info :slight_smile:

hello again everybody,

hope you had some nice Easter-vacation. Anyway, I have continued to create some graphs in root and some new questions have come up. As a reference I have attached the file and an image again. I´d appreciate any help and suggestions a lot!

A.) This concerns the TPalette again. In the forums I have found an example by couet that works perfectly fine for me as well (http://root.cern.ch/phpBB2/viewtopic.php?t=5809&highlight=color+palette), however, when I am trying to use my own data, somehow I get the error “illegal pointer to class object FindObject(“palette”) 0x0 3 analyse_MinimalSigma.root:175:” together with the whole graph (not only the palette). Could you please tell me where my mistake is? (line 175-196)

B.) I have tackled the horizontal Palette issue again (former question #2) and come up with a “compromise” . However I am not sure how to make look neater (but it seems to work! it´s the small bar in the far right). Does anybody know how to have the TImage fill the whole Canvas? I have basically used the tactic from point A.) combined with Rene´s TImage suggestion in http://root.cern.ch/phpBB2/viewtopic.php?t=790&highlight=rotate+tpad . See line 209-215 for that. (PS: A different approach I tried was to take a box, fill it with the palette-colours and rotate it … however I didn´t succeed in that)

C.) This is probably a very basic question, but is there a way to use non-static dimensions? for example, I always have to write the length of any array explicitly to be 529 … instead I would like to define a variable, e.g. n[x] with x=529, so that I can easily change the dimensions. Is that possible with a trick under CINT?

D.) Is there a way how to sum-up settings in a variable? For example, put together the

	Sigma_graph2->GetXaxis()->SetTitle("Membranrauschen"); 
	Sigma_graph2->GetYaxis()->SetTitle("BRT-Schwankung"); 
	Sigma_graph2->GetZaxis()->SetTitle("min_Sigma"); 

in one Variable “dummy” so that the statement “Sigma_graph->dummy;” alone would be enough. This would save a lot of time (not here, but in another example I made and where slight changes are tedious work).

E.) My last suggestion is a super time-saving feature. It would be awesome if changes could be simultaneously in the code … but that´s not possible, is it?

Thanks again for your time.

Rafael


analyse_MinimalSigma.root (7.17 KB)

Before doing the FindObject on “palette” do a gPad->Update()

thanks again couet for your fast reply. I am already doing the “gPad->Update()” as you instructed in my code, however it still doesn´t work (for your example OK, in my specific case somehow not).

Hi,

You may need to do a gPad->Modified() before the gPad->Update() to force the update.

Cheers,
Philippe.

hey phillippe, unfortunatelly your advice didn´t lead to the desired result either. I have put “gPad->Modified()” & " gPad->Update()" combination anywhere I could think of, but somehow it just doesn´t work out …

Anyway, I just wanted to give you guys an update on how I was faring with the horizontal Color-Palette (see the picture attached). So even though it´s kind of cumbersome, it can be done. In my case I used a dummy-pad, where I created the palette only and then transferred it rotated via the TImage to a new pad. In case my explanation didn´t help you much, here we go:

TPad *palette1 = new TPad("pad10","This is pad10",0.348,0.03,0.51,0.14,0); TPad *palette1_dummy = new TPad("pad10","This is pad10",0.37,0.0,0.40,0.26,0);
then

[code] palette1_dummy->cd();

TH2D* h = new TH2D("h", "", 20,-1,1,20,-1,1);
h->FillRandom("gaus", 1E6);
h->GetZaxis()->SetLabelSize(0.09); 				
h->GetZaxis()->SetNdivisions(0); 
h->GetZaxis()->SetLabelOffset(999); 
h->Draw("surfZAfbbb");
ex7->Draw(); //this is for the correct colorbar; based on "multipalette"-tutorial
h->Draw("surfZAfbbb same");
gPad->Update();
TPaletteAxis* zaxis1 = (TPaletteAxis*)h->GetListOfFunctions()->FindObject("palette")->Clone("MyPalette");
delete h; 	

zaxis1->SetX1NDC(0.);
zaxis1->SetX2NDC(0.25);
zaxis1->SetY1NDC(0.15);
zaxis1->SetY2NDC(0.85);
zaxis1->Draw();
gPad->Modified();
gPad->Update(); 

palette1->cd();
TImage *img1 = TImage::Create();
img1->FromPad(palette1_dummy);
img1->Flip(270);
img1->Draw();
delete zaxis1;
palette1->Update();[/code]

cheers,
Rafael

PS: it would still be very nice if anyone could give me a hint to my other questions. Especially D.) -> Is there a way how to sum-up settings in a variable? http://root.cern.ch/phpBB2/viewtopic.php?t=7650&highlight=axis might have been a related qustion, so are “trees” the answer? and if so, can you please give me an example?


I am not completely sure what you are asking for but seems to me you should simply make a C++ function doing that. You group all the settings in one function and then you have only on call… was it your question ?

thanks so much couet … it works now :slight_smile:

in case a newbie such as myself is reading this, it is something like:

int test_program(){
...
TGraph2D *XY_Graph = new TGraph2D();
...
settings(XY_Graph);
XY_Graph->Draw();
}

int settings(TGraph2D *graph)
{

	graph->SetTitle("here ist der Titel");
	graph->GetXaxis()->SetTitle("usw [%]"); 
	graph->GetXaxis()->SetTitleSize(0.05);  
	....
}

By the way couet (or anybody else), can you please tell me if I have wrong settings for ROOT? because as I mentioned before, my ROOT cannot handle non-static dimensions. For example for something like

n =1024;
double test[n];

I obtain the error

[quote]Non-static-const variable in array dimension test_program.root:6:
(cint allows this only in interactive command and special form macro which
is special extension. It is not allowed in source code. Please ignore
subsequent errors.)[/quote]

However, this is used in a lot of tutorials, so I was wondering what is wrong.

Thanks a lot again for any advice.

Hi,

You need to make sure the variable is at least marked as constant. const int n = ...;

Cheers,
Philippe.

thanks a lot Philippe, the “const” does the trick!!!

I suggest you make a fresh post for this because the question you are asking now as nothing to do with the original question, so people might just skip it thinking we are still working on the " issue with my plots" thread. In general it is not a good idea to accumulate many questions in the same thread. It makes it very difficult to read it afterward.

you are right couet, I´ll keep that in mind… i stumbled over those difficulties more or less in the same plot and they are really beginner-questions, that´s why i threw them together even though their nature might be different. thanks for all the feedback again