Issues drawing two TF1s on same plot with different log axis

Hi,

I am trying to plot two TF1s on the same plot with different axis. I managed to do it almost fine, but I am experiencing a few issues which occur especially in log scale.

Here is a simple macro reproducing the problems :

[code]void plot_test()
{
double xmax = 100;

    TF1* a = new TF1("a","x",0,xmax);

// TF1* b = new TF1(“b”,“TMath::Abs(1-x/10)”,0,xmax);
TF1* b = new TF1(“b”,“TMath::Exp(-x/10)”,0,xmax);

    TCanvas *c = new TCanvas();
    TPad *pad1 = new TPad("pad1","",0,0,1,1);
    TPad *pad2 = new TPad("pad2","",0,0,1,1);
    pad2 -> SetFillStyle(4000);    // Makes pad2 transparent

    pad1 -> SetLogy(1);                                                                             
    pad1 -> Draw();
    pad1 -> cd();
                                       
    a -> Draw();
    a -> GetYaxis()->SetRangeUser(.1,100);

    // compute the pad range with suitable margins
    Double_t xmin = 0;
    Double_t dx = (xmax-xmin)/0.8; //10 per cent margins left and right
    Double_t ymin = 0.001;
    Double_t ymax = 1;

    // For linear scale

// Double_t dy = (ymax-ymin)/0.8; //10 per cent margins top and bottom
// pad2->Range(xmin-0.1dx, ymin-0.1dy, xmax+0.1dx, ymax+0.1dy);

    // For log scale
    Double_t dy = (log10(ymax)-log10(ymin))/0.8; //10 per cent margins top and bottom
    Double_t Ymin = log10(ymin)-0.1*dy;
    Double_t Ymax = log10(ymax)+0.1*dy;
    
    pad2 -> Range(xmin-0.1*dx, Ymin, xmax+0.1*dx, Ymax);
    pad2 -> SetLogy(1);                                                                             
    pad2 -> Draw();
    pad2 -> cd();
    b -> SetLineColor(2);
    b -> SetNpx(10000);
    b -> Draw("same");

    // draw axis on the right side of the pad
    TGaxis *axis = new TGaxis(xmax, ymin, xmax, ymax, ymin, ymax, 50510, "+GL");
    axis -> SetLabelColor(kRed);
    axis -> Draw();

}
[/code]

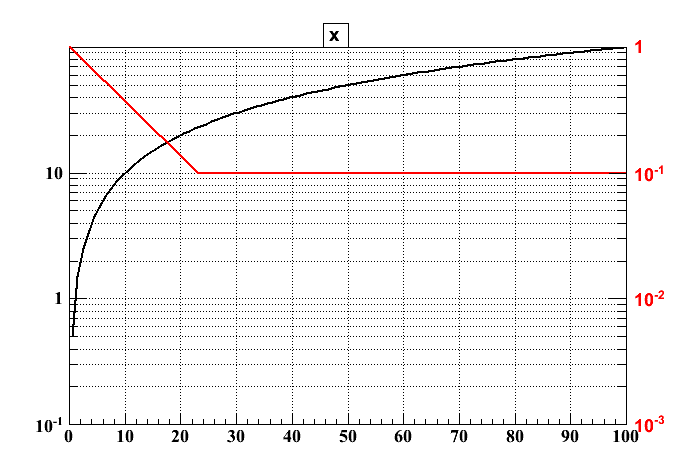
1/ The issue that bothers me the most is that the second TF1 (b) is not correctly drawn. As you can see on figure 1 (red curve), it is truncated at 0.1.

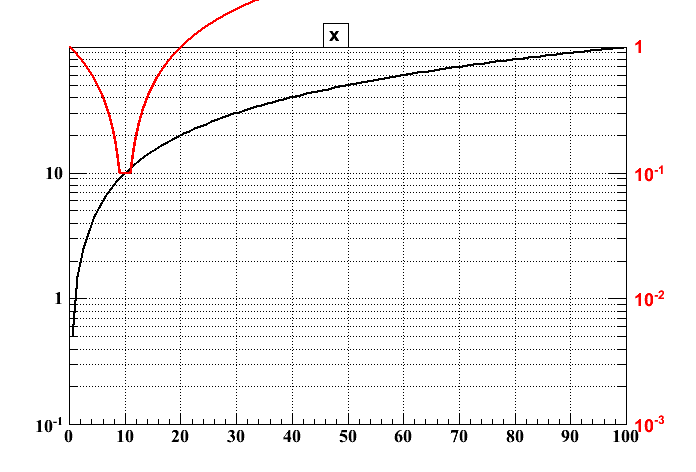
2/ For some expressions the second curve will go out of the frame, as illustrated in figure 2 for b as

TF1* b = new TF1("b","TMath::Abs(1-x/10)",0,xmax);

(in addition to the issue notified in the first point).

3/ Finally, if you want to edit any of the drawn objects using the GUI editor the following issue occurs : you have “click access” to nothing but the second pad and the last drawn object (in this example the additional axis, but if you don’t draw it the second TF1, etc.).

Any suggestion or comment ? Thanks.

PS : I’m using ROOT 5.26/00, trunk@31882.


void plot_test()
{
   double xmax = 100;
 
   TF1* a = new TF1("a","x",0,xmax);
   TF1* b = new TF1("b","TMath::Exp(-x/10)",0,xmax);
 
   TCanvas *c = new TCanvas();
   TPad *pad1 = new TPad("pad1","",0,0,1,1);
   TPad *pad2 = new TPad("pad2","",0,0,1,1);

   pad1->SetLogy(1);                                                            
   pad1->Draw();  
   pad1->cd();  
   a->Draw();  
   a->GetYaxis()->SetRangeUser(.1,100);    

   pad2->SetLogy(1);                                                            
   pad2->SetFrameFillStyle(4000);
   pad2->Draw();
   pad2->cd();  
   b->SetLineColor(2);  
   b->SetNpx(10000);  
   b->Draw("Y+");    
   b->GetYaxis()->SetAxisColor(kRed);
   b->GetYaxis()->SetLabelColor(kRed);
}


Thanks, but actually the transparency won’t work with the Y+ option if you are using gROOT->ForceStyle() somewhere in your macro or in your rootlogon. Neither will it work if you add “b -> GetYaxis()->SetRangeUser(.1,100);” after “b -> Draw(“same”);” in my example.

I suspect that these behaviours are not the ones expected (at least for me), maybe should I file a bug report ?

Try to start root with option " -n" if it your macro produces the same display as the one I sent it means there is something in your rootlogon.C preventing the correct display. (I had to do that myself)

Yes, as said in the previous post the statement preventing the pad transparency in conjugation with the Y+ option is gROOT->ForceStyle(), which I do have in my rootlogon.c.

The Y+ statement allows to draw the axis on right. The way you proceed with you 1st macro war not correct. In particular you where using the option same. That prevent to use the transparent pad. That’s why you had a wrong picture.

Thanks for the clarification. I will use your macro and just comment gROOT->ForceStyle() whenever I want to get such a plot (cannot remember why I need it…).

But is it a normal behaviour that Y+ and transparency won’t work together with gROOT->ForceStyle() ?

It is more that transparency and ForceStyle does not work… + have nothing to do with that. I will check. It might be that you forcing the style does not allow to change the fill style of a frame later on as it was " forced" before.

Actually it does not work if the style is forced after either, but forcing the style works with the “same” option (apart from the 0.1 cutoff issue)…

Anyway, thanks, as far as I am concerned my problem is solved.

As I said the " same" option cannot work. " Same’ means that you wanrtto use the same axis system as the previous plot. That’s obviously not what you want.

But actually, it does work, as you can see in the plots of the first post. And even with ForceStyle(). As I understand it, the “same” applies to the coordinates range defined for the pad. If this is not the wanted behaviour, then there is also some issue here…

But all is drawn in one pad. Try to move the pad with the mouse… you will see

Well, as far as I can see the behaviour is exactly the same in both cases…

BTW, this leads to question 3 of the first post : is there any way to have “click access” to objects of the first pad ? I tried “pad1->cd;” but it does not help.

start your macro with:

  gROOT->ForceStyle(0);

What is it supposed to do ?

the macro works (transparent mode). and you can edit with the mouse (at least that’s what I see here).