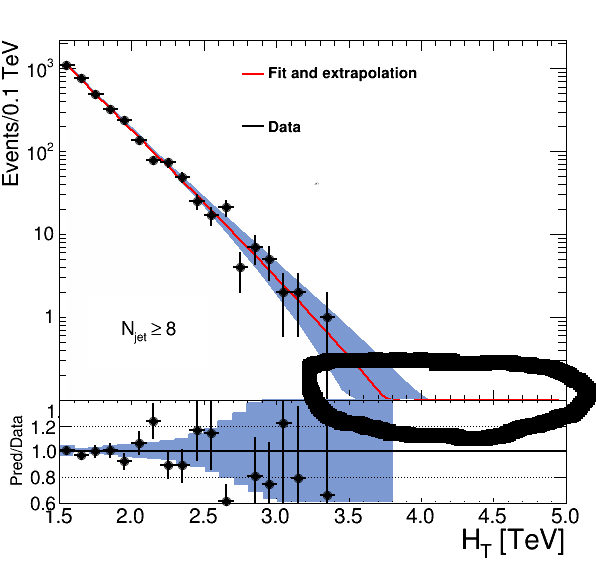
I am having an issue with using hist->Draw(“C”). I attached a plot as an example. I would like to draw a histogram so that at bottom right edge of the x axis of the larger TPad I do not have the red line within the black circle taper off the way it does. Right now the red line is not cutting off where I set hist->SetMinimum(xx), instead it seems to taper off and stick to the xaxis.
Basically I want the histogram curves to terminate where hist->SetMinimum(xx) is determined and “flatten out”
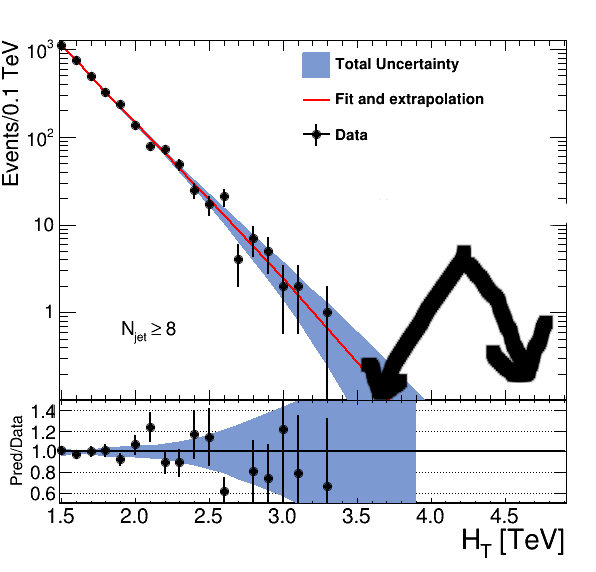
Using Draw(“L”), removes that but the line will still look its “shifted” at the edge of the axis like in attached, hist_1.png, almost like there is sudden abrupt change in the slope.
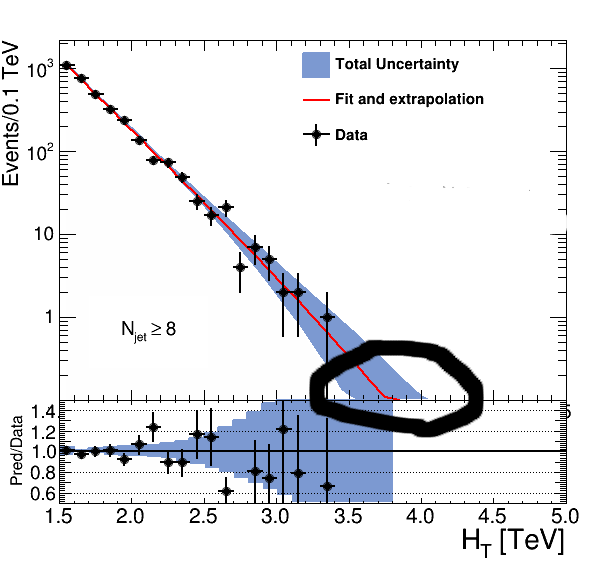
I came up with a workaround yesterday which is to turn all my histograms into TGraphs. Drawing TGraphs as curves doesn’t seem to have this problem. However, you fix one problem and you get two problems, see hist_2.png. Now in the bottom ratio plot, the TGraph lies on top of the horizontal grid lines that I obtained by doing, pad->SetGridy() and blocks it. When this happens for histograms I simply do pad->Redrawaxis(“g”) and that fixes the problem.
However this doesn’t seem to work for TGraphs and short of physically drawing a bunch of TLines manually across the pad I am not sure how to get the SetGridy() horizontal lines back.
In addition to this, where the graph meets the x axis of the respective pad it seems to cut off the thick black line at the lower edge (look at the arrows pointing to the two different locations on the xaxis of the big pad in hist_2.png).