I’m trying to do a linear fit to a TGraphAsymmErrors and plot a 95% confidence interval on this fit. However, on some occasions the result of the TVirtualFitter::GetConfidenceIntervals function doesn’t seem consistent with the result of the fit.
An example python script where I see this issue is shown below. I am currently using ROOT versino 6.02/05 in python 2.7.6.
import ROOT as r
r.gROOT.SetBatch(True)

# Get graph from root file
rootFile = r.TFile("rootFile.root")
graph = rootFile.Get("graph")

# constant fit to graph
fit0 = r.TF1("fit0", "pol0", graph.GetX()[0], graph.GetX()[graph.GetN()-1])
graph.Fit(fit0, "RQN")
print "fit0 p0 = {:.3f} +/- {:.3f}".format(fit0.GetParameter(0), fit0.GetParError(0))

# linear fit to graph
fit1 = r.TF1("fit1", "pol1", graph.GetX()[0], graph.GetX()[graph.GetN()-1])
graph.Fit(fit1, "RQN")
print "fit1 p0 = {:.3f} +/- {:.3f}".format(fit1.GetParameter(0), fit1.GetParError(0))
print "fit1 p1 = {:.3f} +/- {:.3f}".format(fit1.GetParameter(1), fit1.GetParError(1))

# confidence interval
interval = r.TGraphErrors(graph.GetN())
for i in range(graph.GetN()):
    interval.SetPoint(i, graph.GetX()[i], 0)
r.TVirtualFitter.GetFitter().GetConfidenceIntervals(interval, 0.95)

can = r.TCanvas()

# draw axes
graph.SetMarkerStyle(20)
graph.SetMarkerColor(r.kBlack)
graph.SetLineColor(r.kBlack)
graph.SetFillColor(0)
graph.GetHistogram().Draw()

# draw confidence interval
interval.SetFillColor(r.kRed-7)
interval.Draw("3same")

# draw fit
fit1.SetLineColor(r.kRed)
fit1.Draw("same")

# draw graph
graph.Draw("Psame")

can.SaveAs("plot.pdf")
I get the following results from the constant and linear fits:
fit0 p0 =  0.009 +/- 0.007
fit1 p0 = -0.008 +/- 0.014
fit1 p1 =  0.027 +/- 0.020
and the graph, interval and fit1 are shown below.
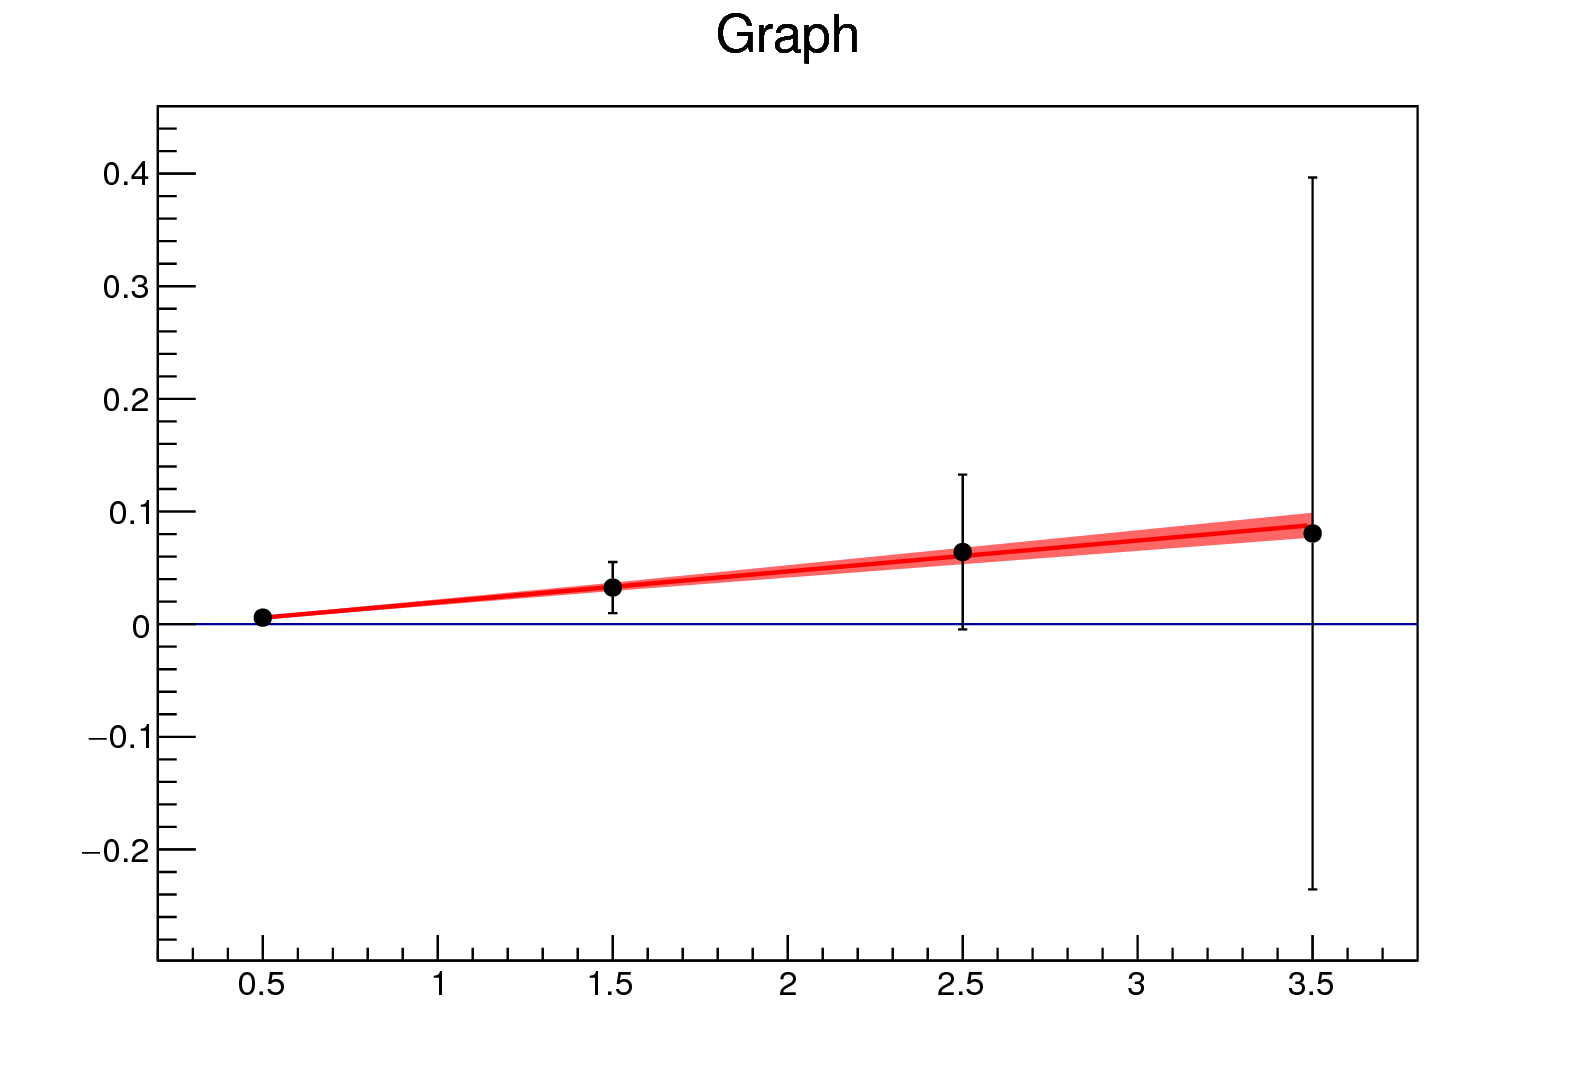
From the fit results, I would’ve naively expected the 95% confidence interval to cover (or at least be closer) to the y=0 line. Even by inspecting the errors on the points of the graph I would expect the 95% confidence interval to be significantly broader. Has anyone met/resolved this issue before?
Thanks in advance for the help.