Issue with plotting uncertainity bands in post-fit plot

Hello Experts,
DoubleHTag_2_13TeV_CMS_hgg_mass.pdf (110.2 KB)
DoubleHTag_2_13TeV_CMS_hgg_mass.root (37.6 KB)

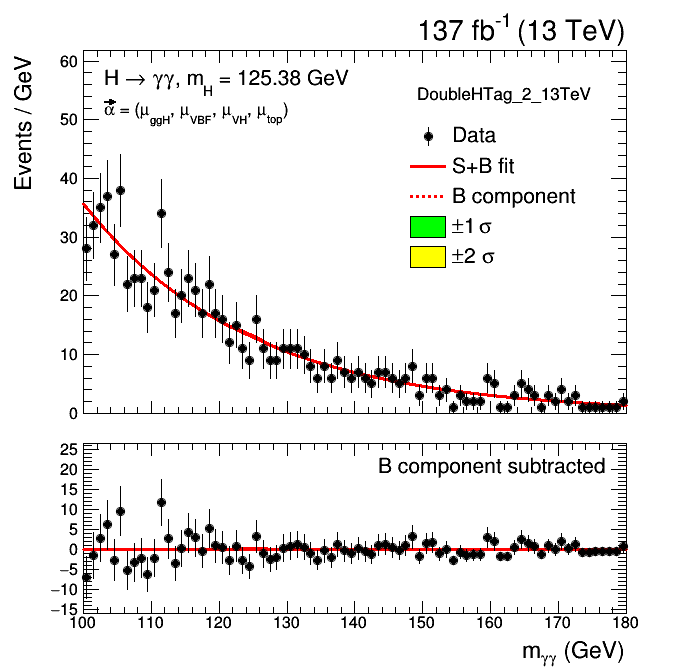
For my analysis, I am trying to plot the post-fit observable (diphoton mass) distribution. I use script one [1] which uses script [2] for plotting. I am attaching a pdf and root file of my plot. It is not plotting the bands as what we see generally see with green and yellow bands. But, in legends, the bands look as expected. I read the full script and I can not find any issue in the code. Could you please help me to understand what could be the reason of having such a zig-zag uncertainty band distribution?

Thanks,

Lata

[1] https://github.com/cms-analysis/flashggFinalFit/blob/dev_fggfinalfits_lite/Plots/makeSplusBModelPlot.py
[2] https://github.com/cms-analysis/flashggFinalFit/blob/dev_fggfinalfits_lite/Plots/plottingTools.py
__
Please read tips for efficient and successful posting and posting code

ROOT Version: Not Provided
Platform: Not Provided
Compiler: Not Provided


Can you try to replace LE3SAME by just 3 . SAME is not a TGraph painting option
and L and E are to needed (see help).

Hello @couet,

Thanks for your reply. I tried with what you suggested. It still does not plot uncertainty bands properly with Draw(“3”) option. I am attaching files with this post. Kindly have a look.

Thanks,
Lata


DoubleHTag_2_13TeV_CMS_hgg_mass.root (37.6 KB)

I have some difficulties running our script:

% python plottingTools.py
Traceback (most recent call last):
  File "plottingTools.py", line 4, in <module>
    import pandas
  File "/Users/couet/git/roottrunk-bin/lib/ROOT/_facade.py", line 162, in _importhook
    return _orig_ihook(name, *args, **kwds)
ImportError: No module named pandas

Hello @couet !

For me it works fine. I do not get any error with the “python plottingTools.py” command. The error you mentioned, it seems pandas is not installed that’s why it shows this. Also, I was thinking to add all these graphs in a multigraph and I will plot that multigraph. Maybe then it could come properly as I want. I will let you know how it goes.

Thanks,

Lata

Ok I have installed pandas but I still get errors.

% python plottingTools.py
Traceback (most recent call last):
  File "plottingTools.py", line 4, in <module>
    import pandas
  File "$ROOTSYS/lib/ROOT/_facade.py", line 162, in _importhook
    return _orig_ihook(name, *args, **kwds)
ImportError: No module named pandas

May be @etejedor will know …

That indicates that pandas is not installed for the python version you are using.

I’d try with python -m pip install --user pandas

Ok it does not work… let’s try to investige the initial problem an other way .

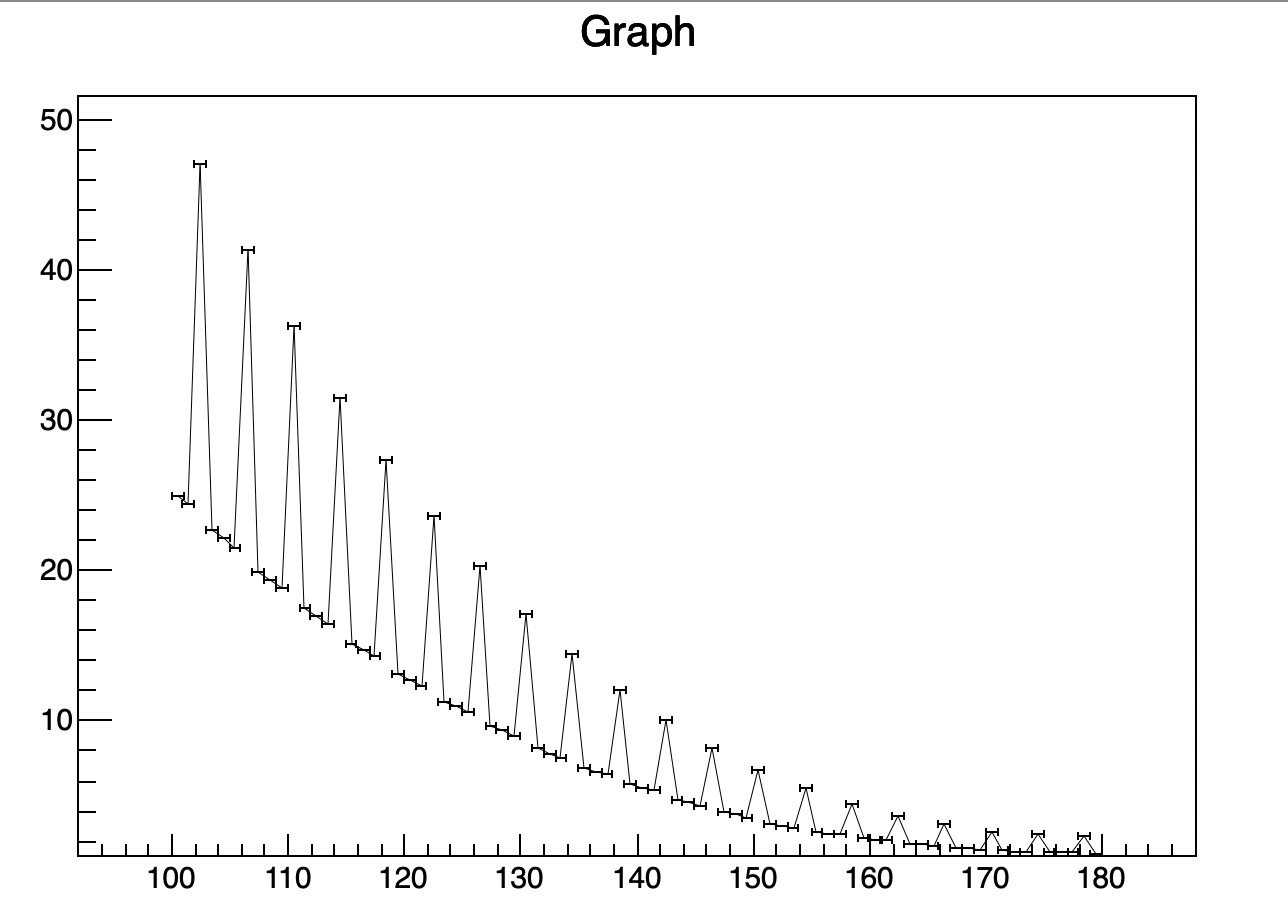
One of the graph drawing the yellow band is: gr_1sig ? right ? Do you see on on the plot draw for instance with normal error bars ? Could it be that this graph is outside the limit of the plots ? TLegend sees that graph correctly it should be stored in the pad. Can you save the canvas as a ROOT file so I can instigate a bit what’s going on ?

Hello @couet ! In my previous post, I have shared canvas with root format also. I am attaching that here again.DoubleHTag_2_13TeV_CMS_hgg_mass.root (37.6 KB)

Lata

Ah yes sorry I missed that.

  1. I managed to click on the invisible graph,
  2. I changed the drawing option to make it visible
  3. I saved it in a .C macro
  4. I edited the .C macro to isolate the graph
  5. I got the attached macro and image.

The problem is clear: your graph has Y errors equal to 0, therefore it is not possible to draw a band.

canv_DoubleHTag_2_13TeV.C (7.5 KB)

Hello @couet ! Thanks for catching my mistake. I have fixed this Y error issue in the code and now my plot with bands is looking good. :slight_smile:

1 Like

This topic was automatically closed 14 days after the last reply. New replies are no longer allowed.