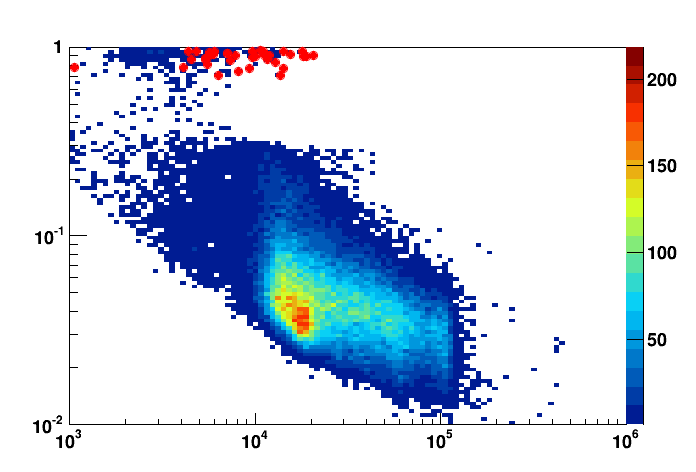
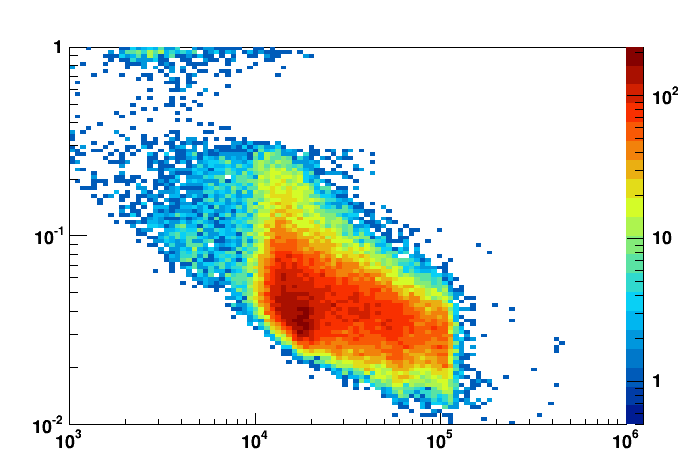
Sorry for the long title, which try to describe a very specific bug I am dealing with: I am drawing two TH2 histo superposed each having a custom binning, the first one with “col2z” option and the second one with “same” (markers). The second histo is visible in linear Z scale, but disappear when switching to LOGZ. This is however working fine when using regular histogram (linear binning), and so this looks to be proper to TH2 when using a custom binning (logarithmic in my case). ROOT version is 5.34/14 and an example is attached bellow.
Is it known and is there eventually a way to fix it ?
Today I encountered same issue,
I compiled a tiny demo program to reproduce the issue, and contrary to my expectation it worked well,
it is the file named “testLogz.C”.
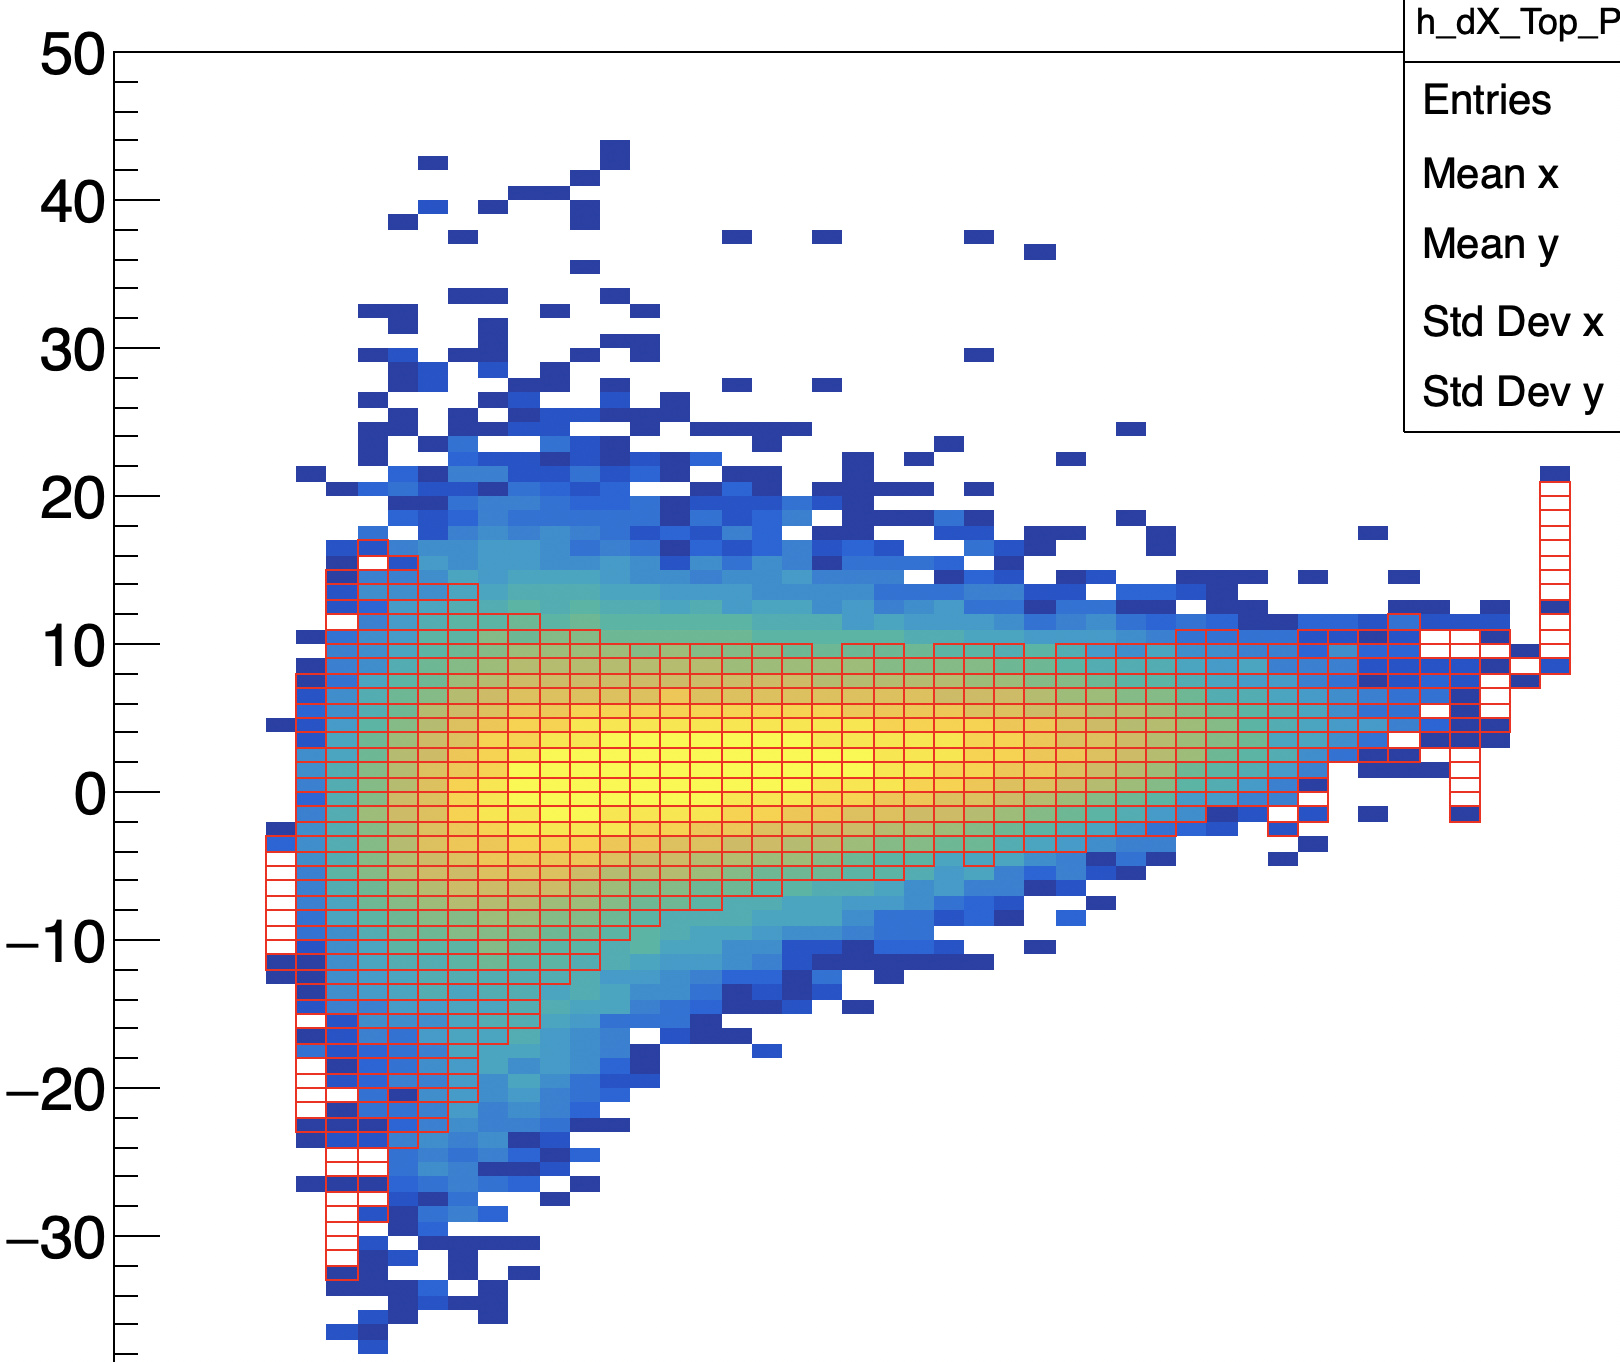
Then I made another simple code which is closer to what I am doing, i.e. reading histograms
from the root file, and then draw them on top of each other one with colz, the other is a scatter plot with a certain marker type and color.
This time I was able to reproduce the issue.
The plots demonstrating the issue, as well the root file and the code (“testLogz2.C”) are attached.
I see,
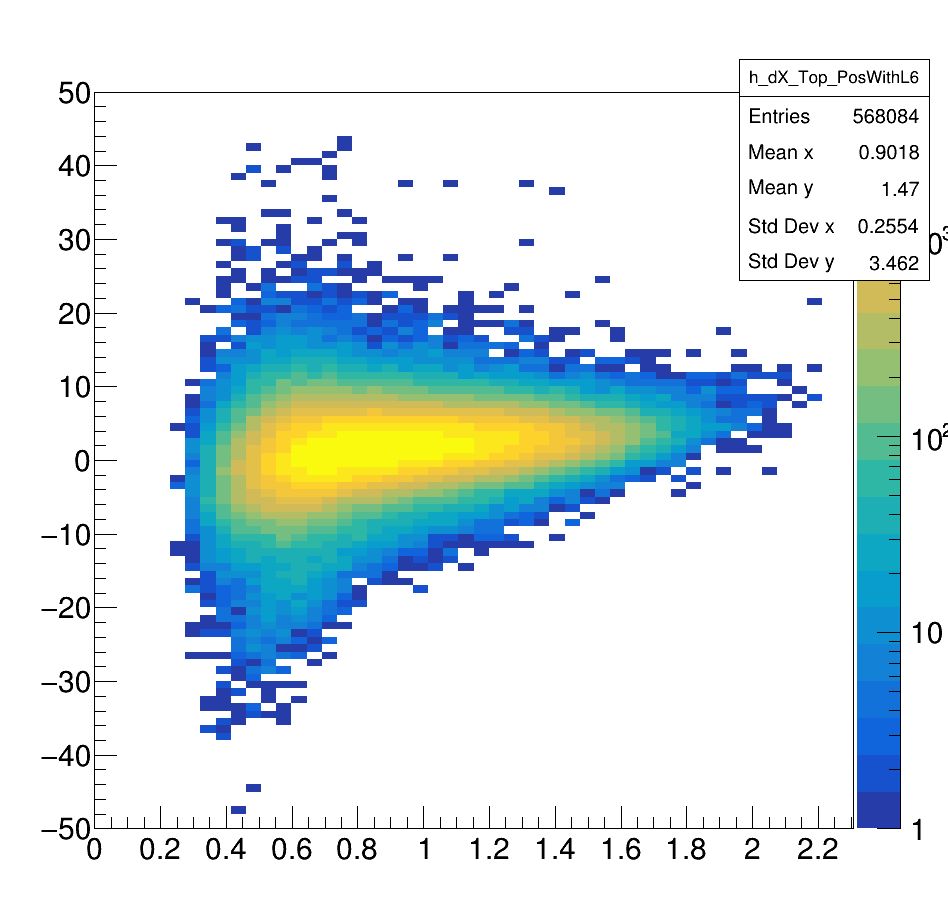
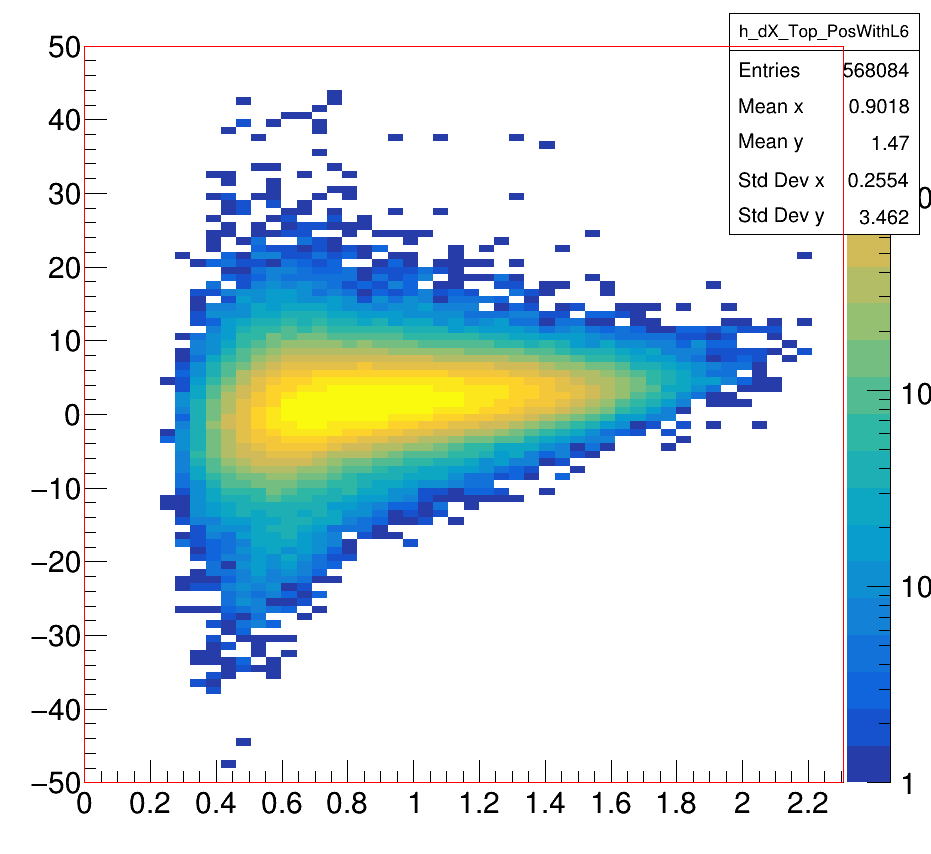
I need to check. Your second histogram is flat (at 1) that might be the reason why the scatter plot does not show. Meanwhile You can use an other box:
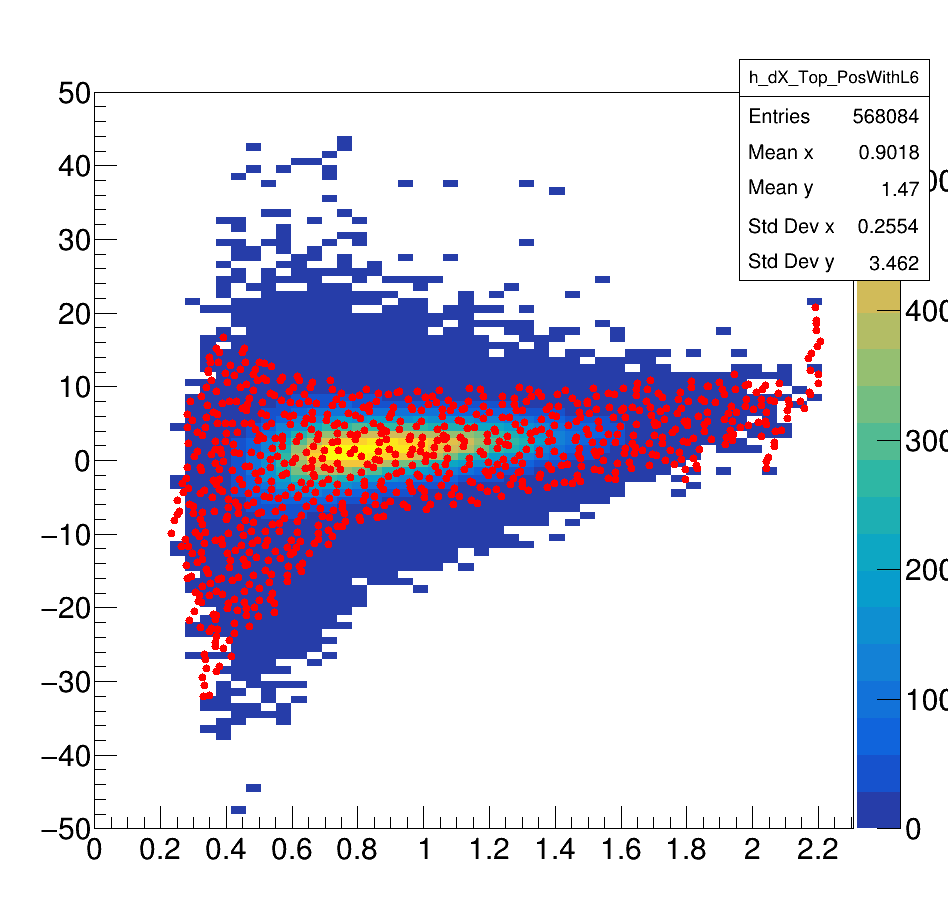
the box also will work, though, I would like markers, if that would be possible.
Also with the box I had to artificially scale the _Cut histogram with a big number.
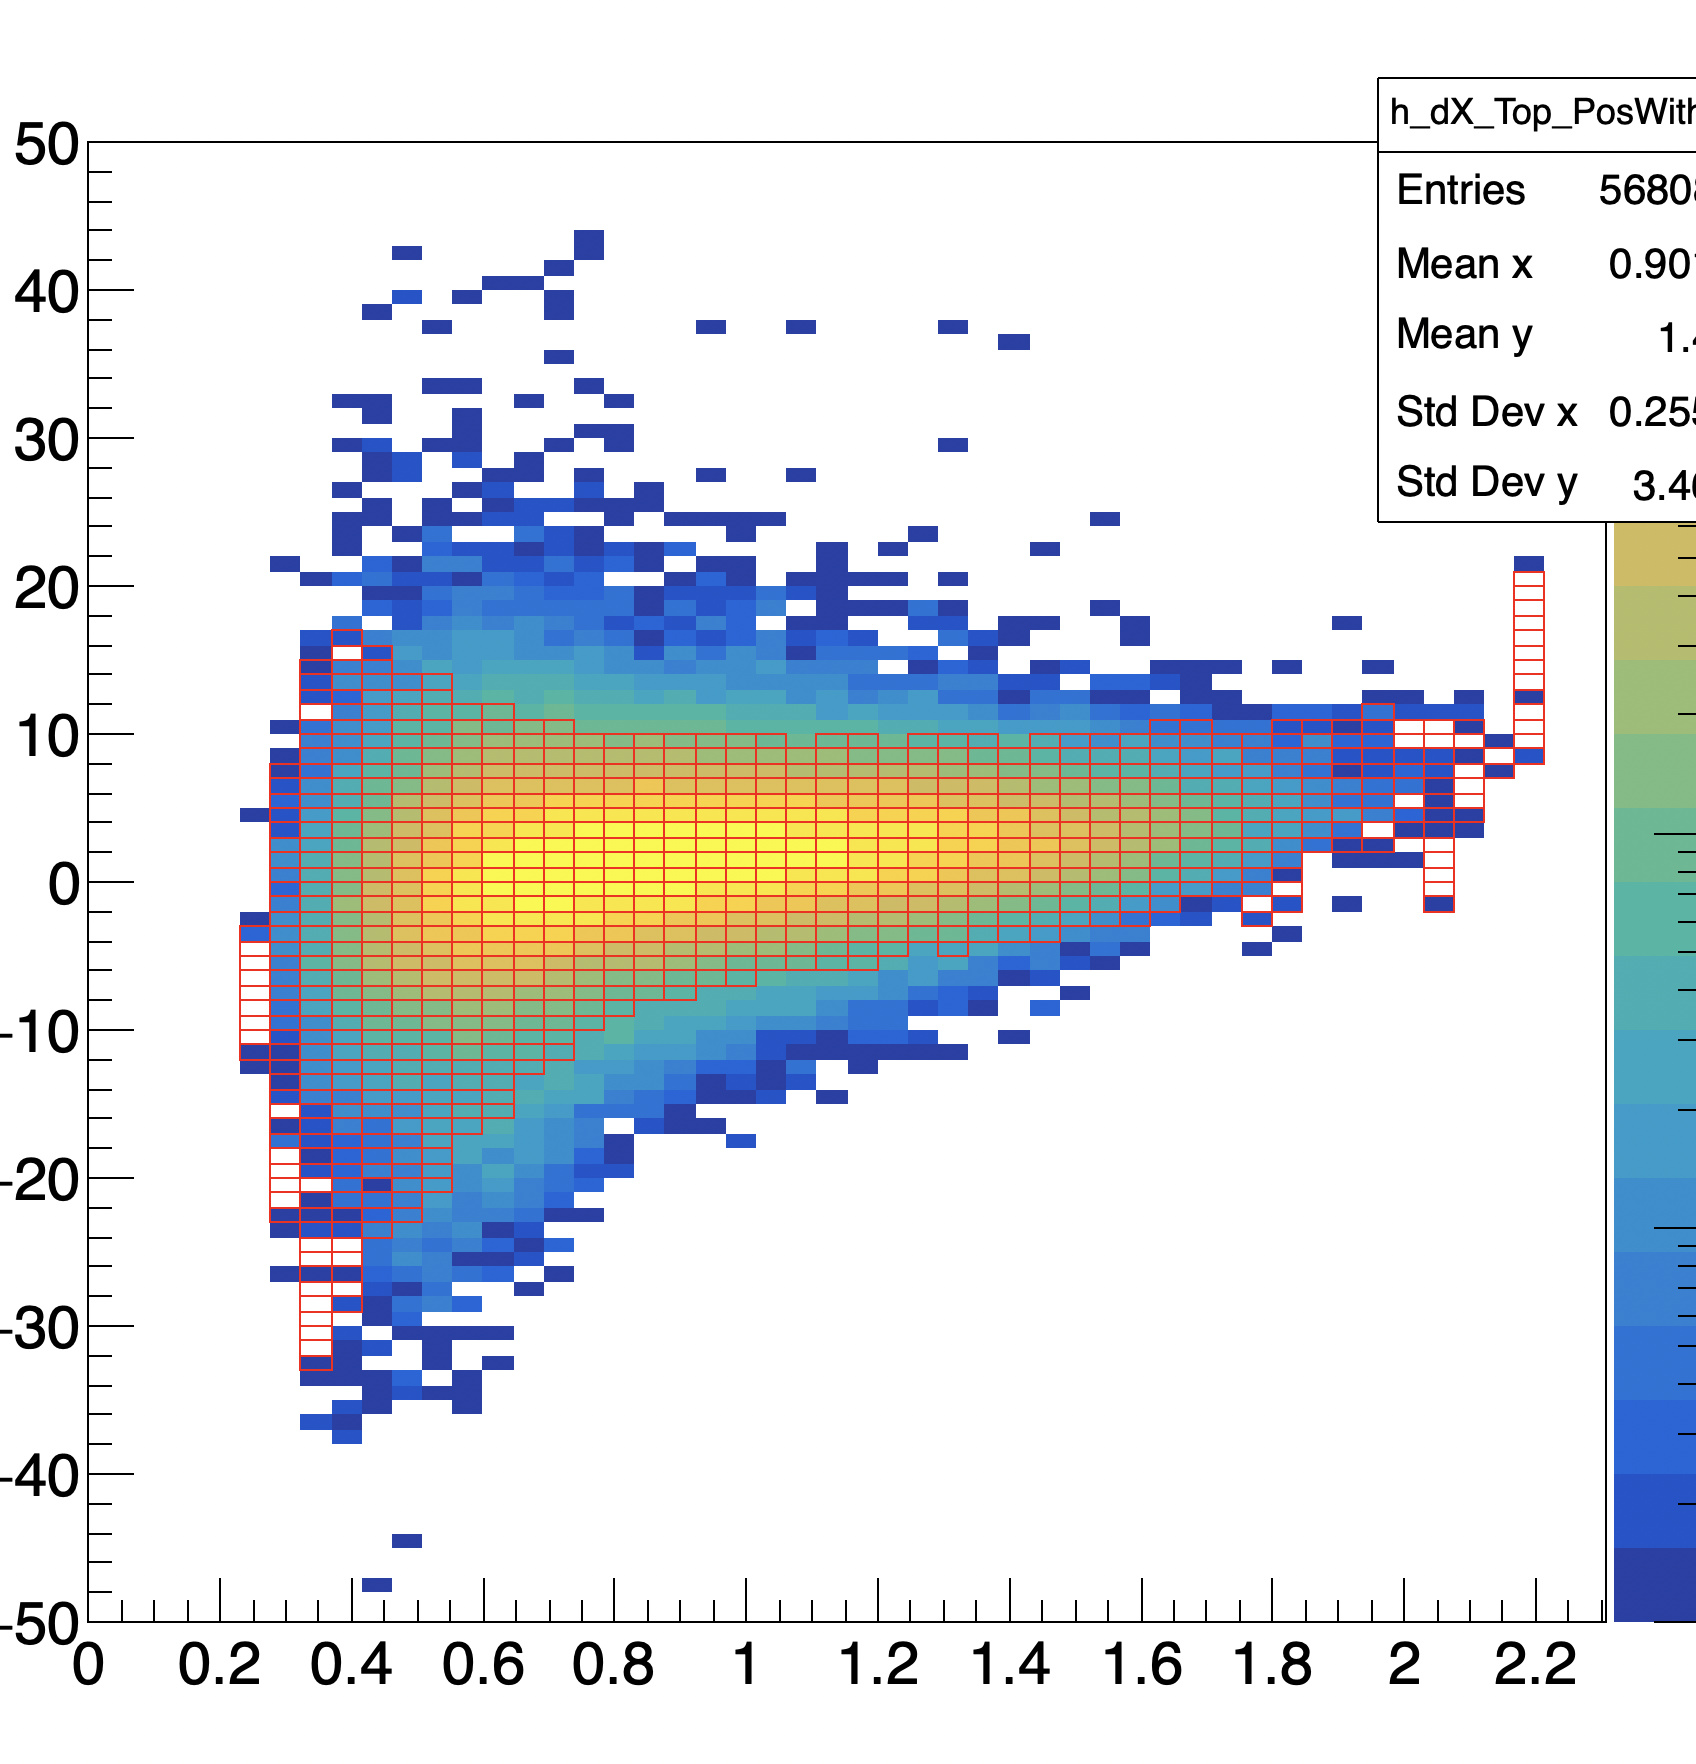
For some reason it changed the frame color, and the “_Cut” histogram didn’t draw (probably box size was too small).
Yes, I am using “same0” option,
This is done with your snipped.
As you can see for some reason it changed the Frame color without drawing the “_Cut” histogram
perhaps it is from my Root version then, or related to my OS, or maybe something else.
Anyway it is not hard for me to scale it, and doesn’t affect the analysis, so I am good,