Issue with Legend Placement in ROOT for Different Centralities

Greetings!
I am working on a particle physics analysis where I need to plot histograms for different centrality bins in Pb-Pb collisions (using ROOT). I have successfully adjusted the legend position for centrality 0 (0-5%), but when I apply the same settings to centrality 4 (30-40%), the alignment and formatting do not appear as expected.

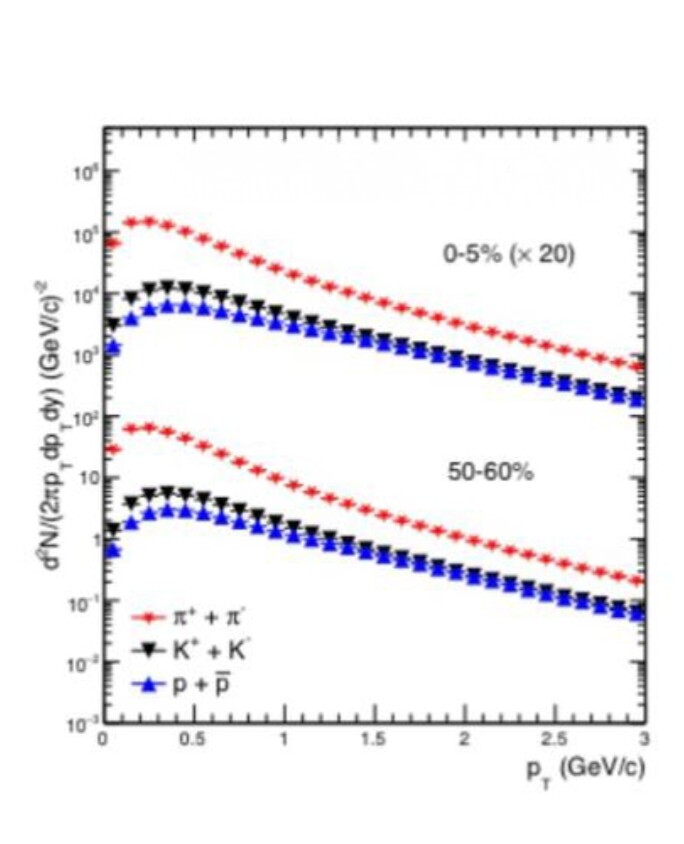
I want the legend for centrality 4 and other plots to exactly match the legend of the image which i have uploaded.

Has anyone encountered a similar issue? Any suggestions on how to ensure a consistent legend appearance across different centralities?

here is the snippet of the the code.

TLegend* legend3 = new TLegend(0.50, 0.75, 0.72, 0.85,NULL,"brNDC");
        legend3->SetFillStyle(0);
        legend3->SetTextSize(0.035);
        legend3->SetBorderSize(0);
        legend3->SetLineColor(0);
        legend3->SetFillColor(0);
        legend3->SetTextFont(42);
        legend3->SetNColumns(2);
  
    legend3->SetHeader("#it{Pb-Pb}, #sqrt{#it{s}_{NN}} = 5.02 TeV, #left|#it{y}#right| < 0.5");  //#left|#eta#right|
    legend3->AddEntry(h1, "#pi^{+} + #pi^{-}", "pl");
    //legend3->AddEntry(h4, "#pi^{-}", "pl");
        
    legend3->AddEntry(h2, "K^{+} + K^{-}", "pl");
    //legend3->AddEntry(h5, "K^{-}", "pl");

    legend3->AddEntry(h3, "p^{+} + p^{-}", "pl");
    //legend3->AddEntry(h6, "p^{-}", "pl");

     legend3->Draw();

    TLegend* legend4 = new TLegend(0.50, 0.75, 0.72, 0.85,NULL,"brNDC");
        legend4->SetFillStyle(0);
        legend4->SetTextSize(0.035);
        legend4->SetBorderSize(0);
        legend4->SetLineColor(0);
        legend4->SetFillColor(0);
        legend4->SetTextFont(42);
        
    legend4->AddEntry(h1, "0#minus5% (#times 10^{3})", "");
   // legend1->AddEntry(h2, "Label2", "l");
     legend4->Draw();

Welcome to the ROOT Forum!
I’m sure @couet can help

In principle you should get the same result. Can you provide a self consistent macro we can run showing the problem ?

Due to new user, i am facing an issue while uploading the macro. Now, how can i share macro?

Please try again

normal_spectr01.cpp (30.3 KB)

here is the macro, which i am running and facing the issue described earlier. the target is to set the plots according to the provided image. kindly suggest some necessary editing in the code to get exact plot

Thanks for your file I got it. How do I run it in ROOT ? It has a main program and some code appears to be outside any C function. Can you instruct me how I should run it ?

i ran using these commands.
root - l
.L normal_spectr01.cpp
main()

i ran this file
.L normal_spectr01.cpp
main()

I asked because it gives me:

root [0] .L normal_spectr01.cpp
In file included from input_line_8:1:
/Users/couet/Downloads/normal_spectr01.cpp:69:26: warning: variable length arrays in C++ are a Clang extension [-Wvla-cxx-extension]
    TH1D* hPiPlus_energy[numFiles][numCentralityBins];
                         ^~~~~~~~
/Users/couet/Downloads/normal_spectr01.cpp:69:26: note: function parameter 'numFiles' with unknown value cannot be used in a constant expression
/Users/couet/Downloads/normal_spectr01.cpp:61:61: note: declared here
void DrawAndNormalizeHistograms(TFile** f_energy, const int numFiles) {
`.....

after this, i use main() to draw the plots on TCanvas
Respected Sir, i just want to smooth the flow legends and set their positions according to the reference image

The data file is missing:

root [1] main()
Error in <TFile::TFile>: file /home/ahmad/Downloads/ResultOut_0allPbPb5p02.root does not exist

 *** Break *** segmentation violation

Respected Leader!
Should I send “ResultOut_0allPbPb5p02.root” file also to run it successfully?

ResultOut_0allPbPb5p02.root (317.7 KB)
here is the data file

Hi @Physics_Wala,
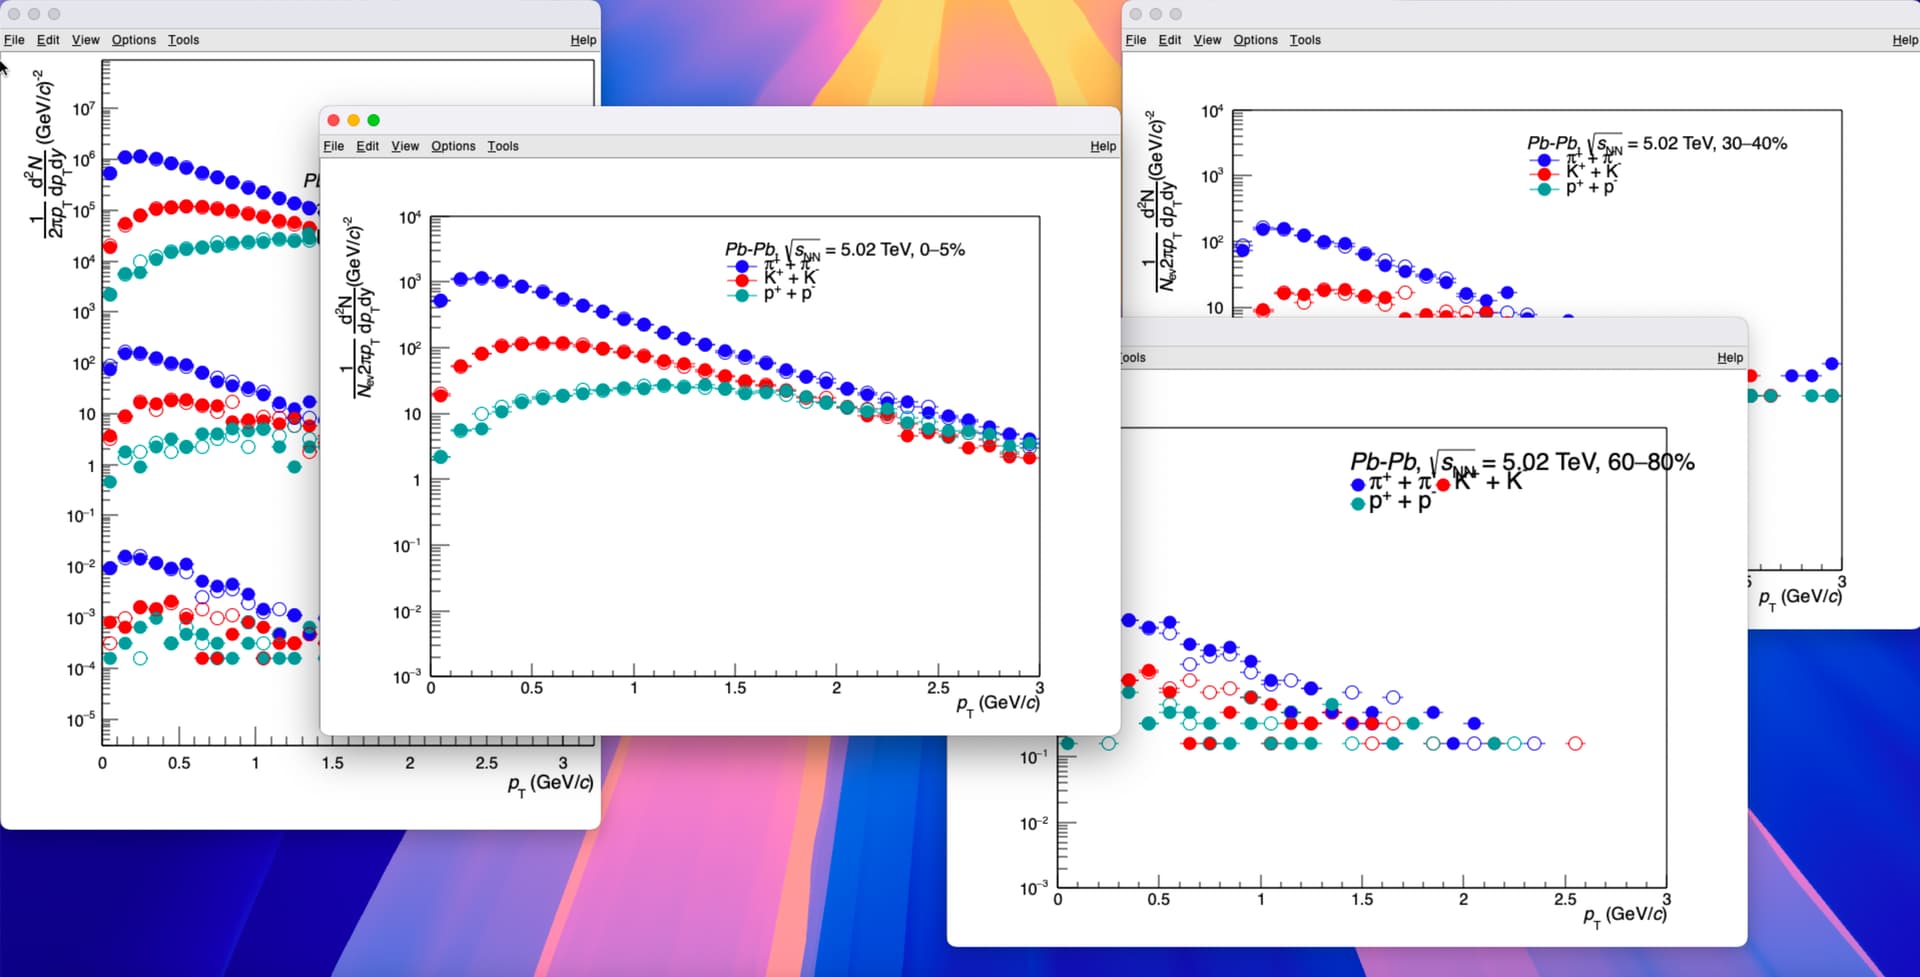
Despite the many warnings your macro gives, your macro produces 4 canvases. Shown in the following picture. What should be changed in these pictures ?

firstly, their range has to be set from 10^-3 to 10^6
Secondly, the flow of the legends make smooth in all canvases

In your macro you define the scale of your plots with DrawFrame. Change 10000 to 1000000 and your plots will be from 10^-3 to 10^6

I am not sure what you mean. What is wrong with the legends ? you want to move them ?


Yes! want to move and make them like in the image which i have attached now.

The legends’ positions is defined in the TLegend constructor.

You can change them for instance to TLegend(0.15, 0.15, 0.57, 0.25, NULL,"brNDC");
But this has to be adjusted for each canvas depending on what is on the canvas and where is more space to place the legend. Just play with the parameters to adjust them the best way.
The parameters are x1, y1, x2, y2, in that order, and are in the normalised space.