ROOT Version: 6.34.02
Platform: win64 (Windows 11)
Compiler: MSVC 19.39.33521.0
I am attempting to make some mass distribution histograms of the phi meson for 4 different beam polarizations and 10 t-ranges. I have defined these 40 histograms both using a nested loop and a stringstream so that each histogram has an easy-to-understand name and title.
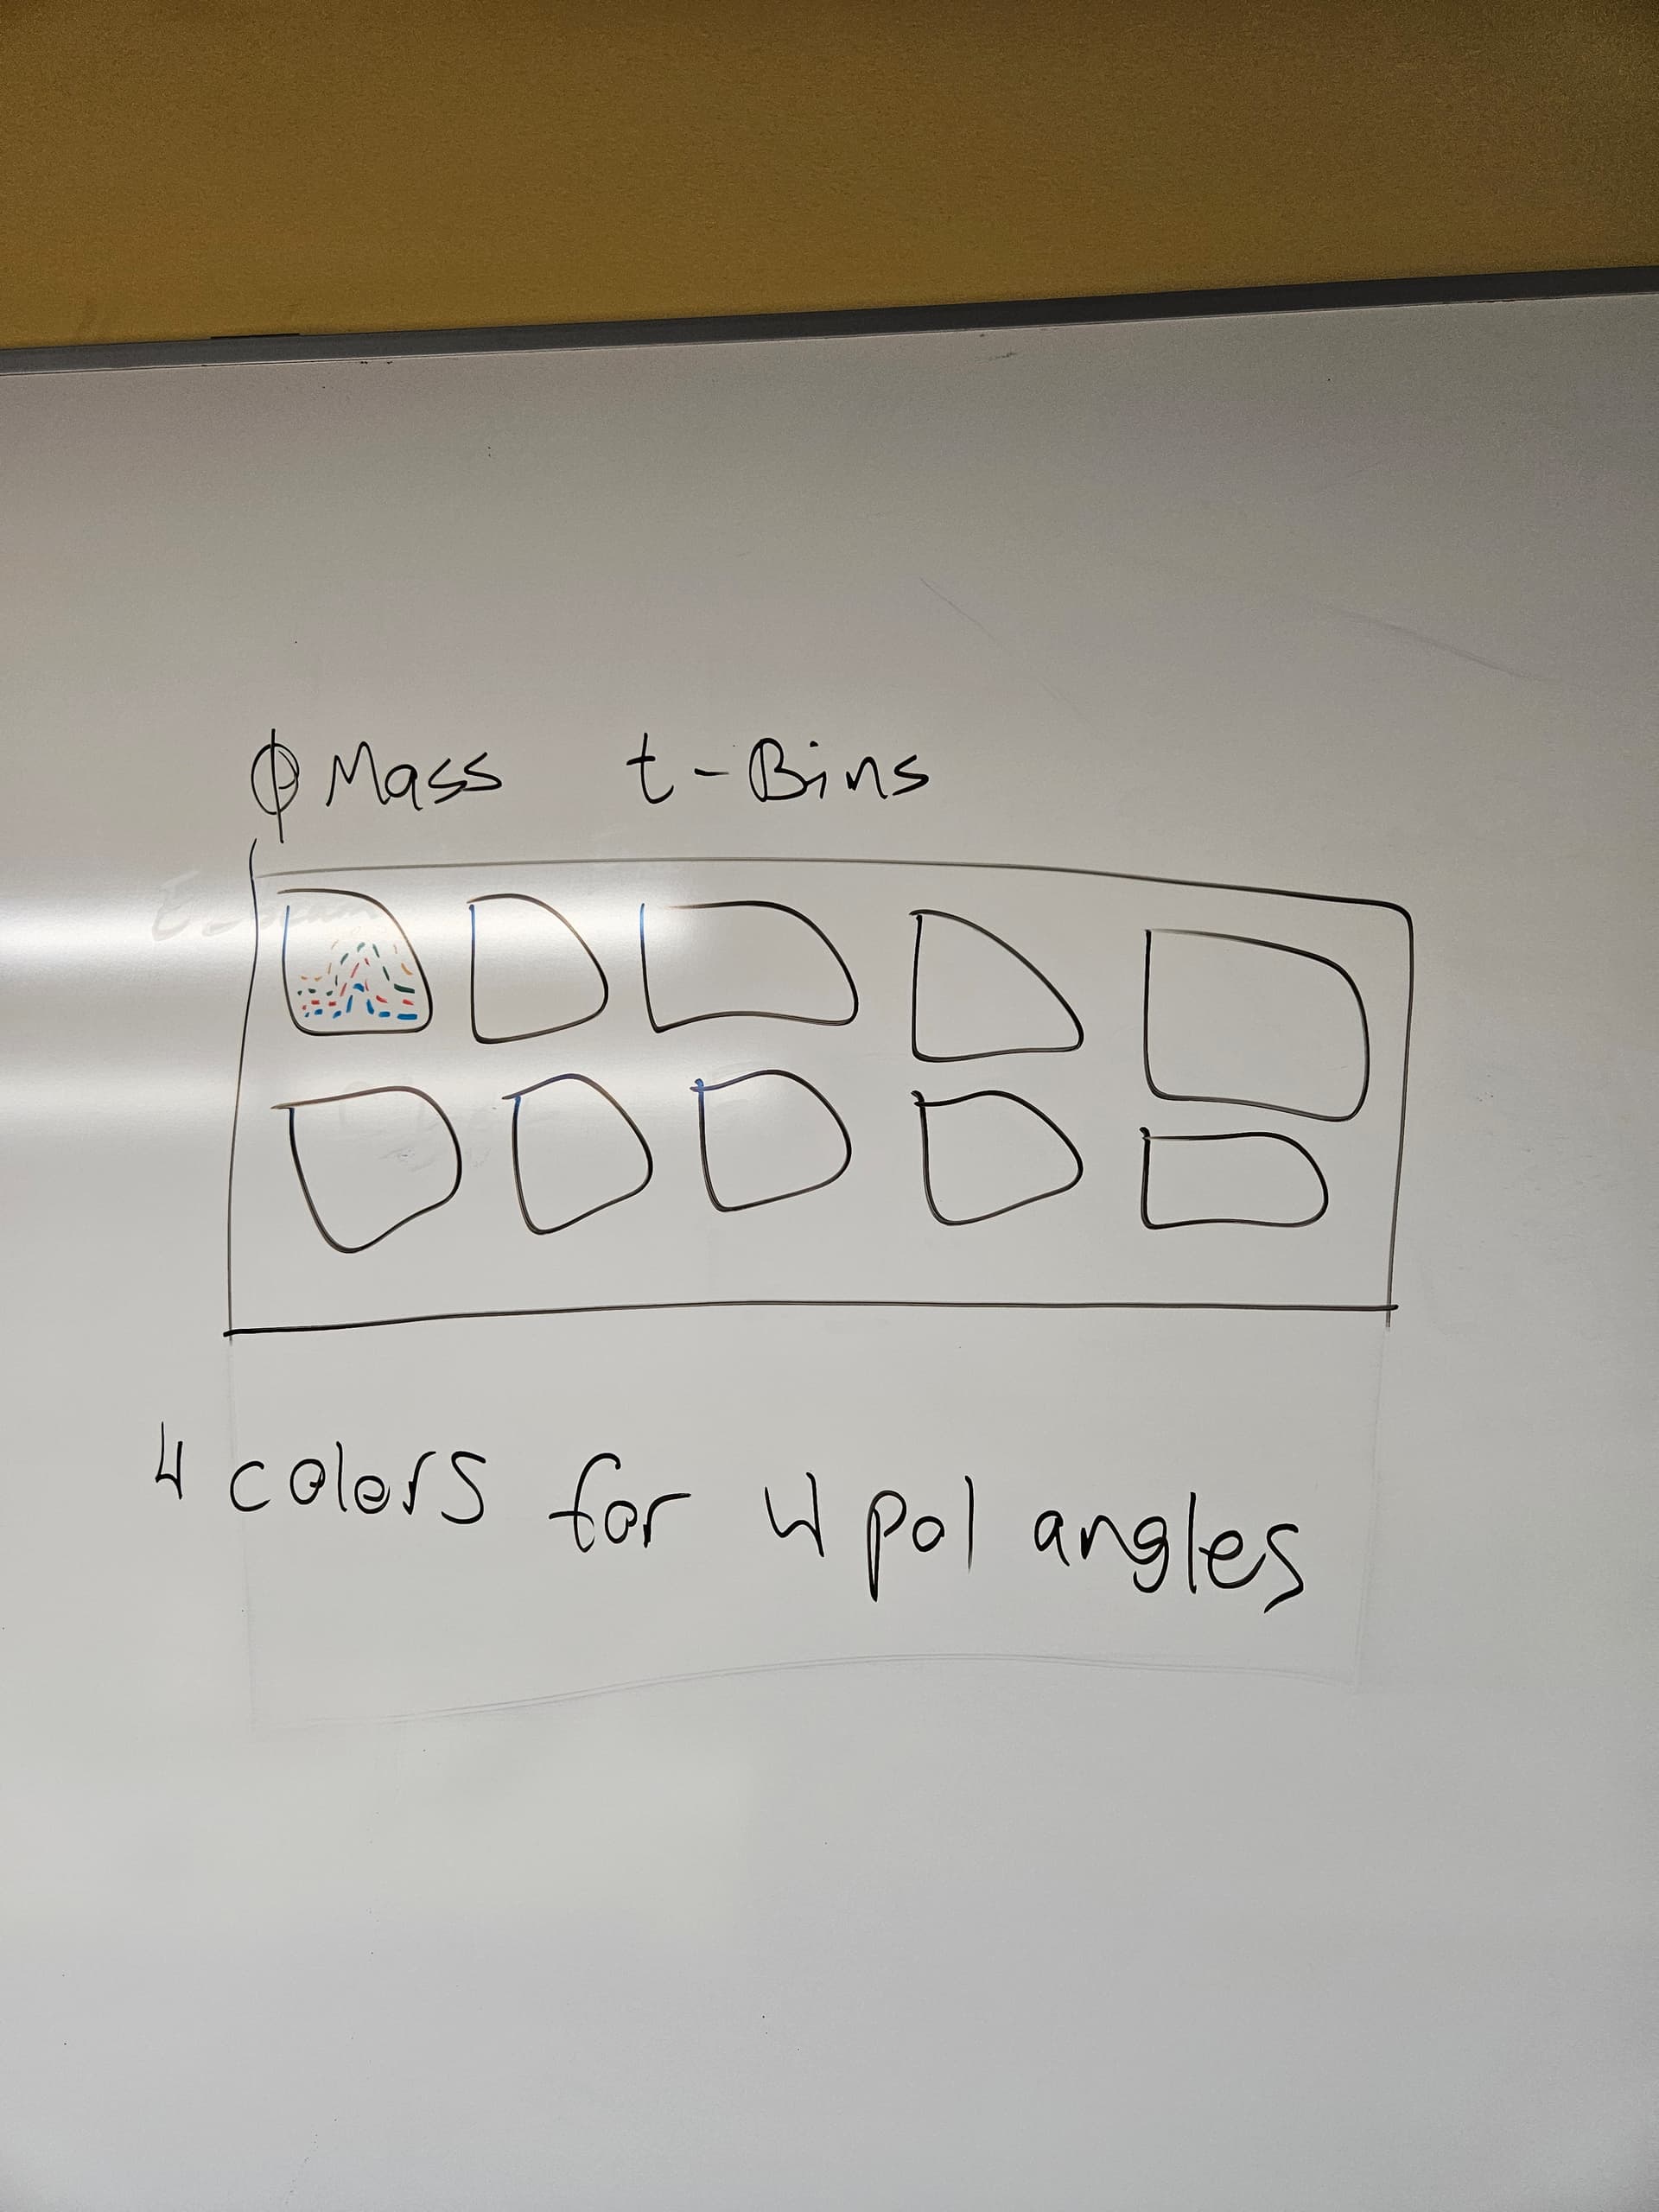
Ultimately, I want to have a single canvas with a total of 10 pads so that all 4 polarization angles are displayed on the same graph with the corresponding t-range kind of like this crude drawing:
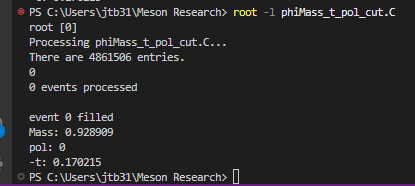
When drawing the histograms, the code runs as normal with now issues, but instead of a CMake window popping up, the ROOT icon appears on my taskbar, then after a couple seconds ROOT closes.
I ran another macro with a similar structure as this one and all the histograms were drawn as normal. I can’t seem to find where the problem is in my code.
void phiMass_t_pol_cut() {
    TFile *filein = new TFile("flat_pi0pippim__B4_cut.root");
    TTree *tree = (TTree *)filein->Get("pi0pippim__B4_cut");

    UInt_t run;
    Int_t pol;
    float tagWeight, Mandelstam_t;

    TLorentzVector *pim_p4_kin = 0;
    TLorentzVector *pip_p4_kin = 0;
    TLorentzVector *decaypi0_p4_kin = 0;

    tree->SetBranchAddress("decaypi0_p4_kin", &decaypi0_p4_kin);
    tree->SetBranchAddress("pim_p4_kin", &pim_p4_kin);
    tree->SetBranchAddress("pip_p4_kin", &pip_p4_kin);

    tree->SetBranchAddress("run", &run);
    tree->SetBranchAddress("tagWeight", &tagWeight);
    tree->SetBranchAddress("pol", &pol);
    tree->SetBranchAddress("Mandlestam_t", &Mandelstam_t);

    //define the histograms loop

    int polValues[4] = {0, 90, 45, 135};
    ostringstream histName, histTitle;

    int t_bins = 10;

    TH1F *h_PhiMass_pol_t_[4][10];
    for (int i : polValues) {
        for (int j = 0; j < t_bins; j++) {

            histName.str("");
            histName << "h_PhiMass_pol" << i << "_t" << std::setw(2) << std::setfill('0') << j << std::setw(2) << std::setfill('0') << j + 1;
            //cout << histName.str() << endl;

            float t_lower = j * 0.1;
            float t_upper = (j + 1) * 0.1;

            histTitle.str("");
            histTitle << std::fixed << std::setprecision(2) << t_lower << " < -t < " << t_upper << ";M(#phi) [GeV/c^{2}]";
            //cout << histTitle.str() << endl;
            //cout << i << endl;

            h_PhiMass_pol_t_[i][j] = new TH1F(histName.str().c_str(), histTitle.str().c_str(), 100, 0.9, 1.2);
        }
    }

    TStyle *dStyle = new TStyle("JLab_Style", "JLab_Style");
    dStyle->Reset("Modern");

    TLorentzVector Pi0P4, PiMinusP4, PiPlusP4, PhiP4;

    Long64_t NEntries = tree->GetEntries();

    cout << "There are " << NEntries << " entries." << endl;

    for (Long64_t i_entry = 0; i_entry < NEntries; i_entry++) {

        tree->GetEntry(i_entry);

        if (i_entry % 400000 == 0) {
            cout << i_entry << " events processed" << endl;
        }

        PiMinusP4.SetPxPyPzE(pim_p4_kin->Px(), pim_p4_kin->Py(), pim_p4_kin->Pz(), pim_p4_kin->E());
        PiPlusP4.SetPxPyPzE(pip_p4_kin->Px(), pip_p4_kin->Py(), pip_p4_kin->Pz(), pip_p4_kin->E());
        Pi0P4.SetPxPyPzE(decaypi0_p4_kin->Px(), decaypi0_p4_kin->Py(), decaypi0_p4_kin->Pz(), decaypi0_p4_kin->E());

        PhiP4 = PiMinusP4 + PiPlusP4 + Pi0P4;

        double PhiMass = PhiP4.M();

        //fill the histograms loop
        for (int i : polValues) {
            for (int j = 0; j < t_bins; j++) {

                float t_lower = j * 0.1;
                float t_upper = (j + 1) * 0.1;

                if (pol == i) {
                    if (-Mandelstam_t > t_lower && -Mandelstam_t < t_upper) {
                        h_PhiMass_pol_t_[i][j]->Fill(PhiMass, tagWeight);
                    }
                }
            }
        }
    }

    // Size & Margins
    dStyle->SetCanvasDefH(800);
    dStyle->SetCanvasDefW(1200);

    // Basic object fill colors
    dStyle->SetCanvasBorderMode(0);
    dStyle->SetLegendFillColor(0);
    dStyle->SetCanvasColor(0);

    // Stat box
    dStyle->SetOptFit(112);
    dStyle->SetOptStat(10); // entries only //mean/rms should be replaced with a fit

    // Titles and Labels
    dStyle->SetLabelSize(0.07, "xyz");
    dStyle->SetTitleSize(0.075, "xyz");
    dStyle->SetTitleOffset(1.1, "x");
    dStyle->SetTitleOffset(0.8, "y");

    // Margins (correlated with title/label size)
    dStyle->SetPadBottomMargin(0.15);

    // Default Histogram Style Settings
    // dStyle->SetHistFillColor(kTeal);
    dStyle->SetHistFillStyle(1001); // solid fill (0 for hollow) //see http://root.cern.ch/root/html/TAttFill.html
    dStyle->SetHistLineColor(kBlack);
    dStyle->SetHistMinimumZero(kTRUE);

    // Default Function Style Settings
    dStyle->SetFuncColor(kBlack);
    dStyle->SetFuncStyle(1); // see http://root.cern.ch/root/html/TAttLine.html
    dStyle->SetFuncWidth(3);

    // Default Line Style Settings
    dStyle->SetLineColor(kBlack);
    dStyle->SetLineStyle(1); // see http://root.cern.ch/root/html/TAttLine.html
    dStyle->SetLineWidth(1); // is border of TLegend

    // Default Graph Style Settings
    dStyle->SetMarkerColor(kBlack);
    dStyle->SetMarkerSize(1);   // see http://root.cern.ch/root/html/TAttMarker.html
    dStyle->SetMarkerStyle(22); // see http://root.cern.ch/root/html/TAttMarker.html

    // Grid
    dStyle->SetPadGridX(kTRUE);
    dStyle->SetPadGridY(kTRUE);

    // Histogram/Graph Title Size
    dStyle->SetTitleSize(0.075, "t"); //"t": could be anything that is not "x" "y" or "z"

    // Palette
    dStyle->SetNumberContours(200);
    #if ROOT_VERSION_CODE >= ROOT_VERSION(6, 0, 0)
        dStyle->SetPalette(kBird); // 57
    #else
        dStyle->SetPalette(55); // rainbow
    #endif
        dStyle->cd();
        TLatex ytitle;
        TLatex maintitle;
        TLatex xtitle;
        xtitle.SetTextFont(42);
        ytitle.SetTextFont(42);
        gStyle->SetOptStat(0000);


    TCanvas *c1 = new TCanvas("c1", "Phi Masses", 800, 600);
    c1->Divide(5, 2);
    c1->cd(1);
    h_PhiMass_pol_t_[0][0]->Draw();


   /* for (int i : polValues) {
        for (int j = 0; j < t_bins; j++) {
            c1->cd(j + 1);
            if (i == 0) {
                h_PhiMass_pol_t_[i][j]->SetMarkerColor(kBlack);
                h_PhiMass_pol_t_[i][j]->SetMarkerStyle(20);     //circle
            }

            if (i == 90) {
                h_PhiMass_pol_t_[i][j]->SetMarkerColor(kRed);
                h_PhiMass_pol_t_[i][j]->SetMarkerStyle(21);    //square
            }

            if (i == 45) {
                h_PhiMass_pol_t_[i][j]->SetMarkerColor(kBlue);
                h_PhiMass_pol_t_[i][j]->SetMarkerStyle(22);  //triangle
            }

            if (i == 135) {
                h_PhiMass_pol_t_[i][j]->SetMarkerColor(kGreen);
                h_PhiMass_pol_t_[i][j]->SetMarkerStyle(34);  //plus
            }

            h_PhiMass_pol_t_[0][0]->Draw();

        }
    }*/
}