Issue with 2D TEfficiency Statistical Uncertainty

Dear Experts,

I am making 2D TEfficiencies to model trigger efficiency and I see what I would have thought is weird behavior when plotting them. When I try to plot the 2D TEfficiency in the TBrowser (using the draw option e) I get the following plot:


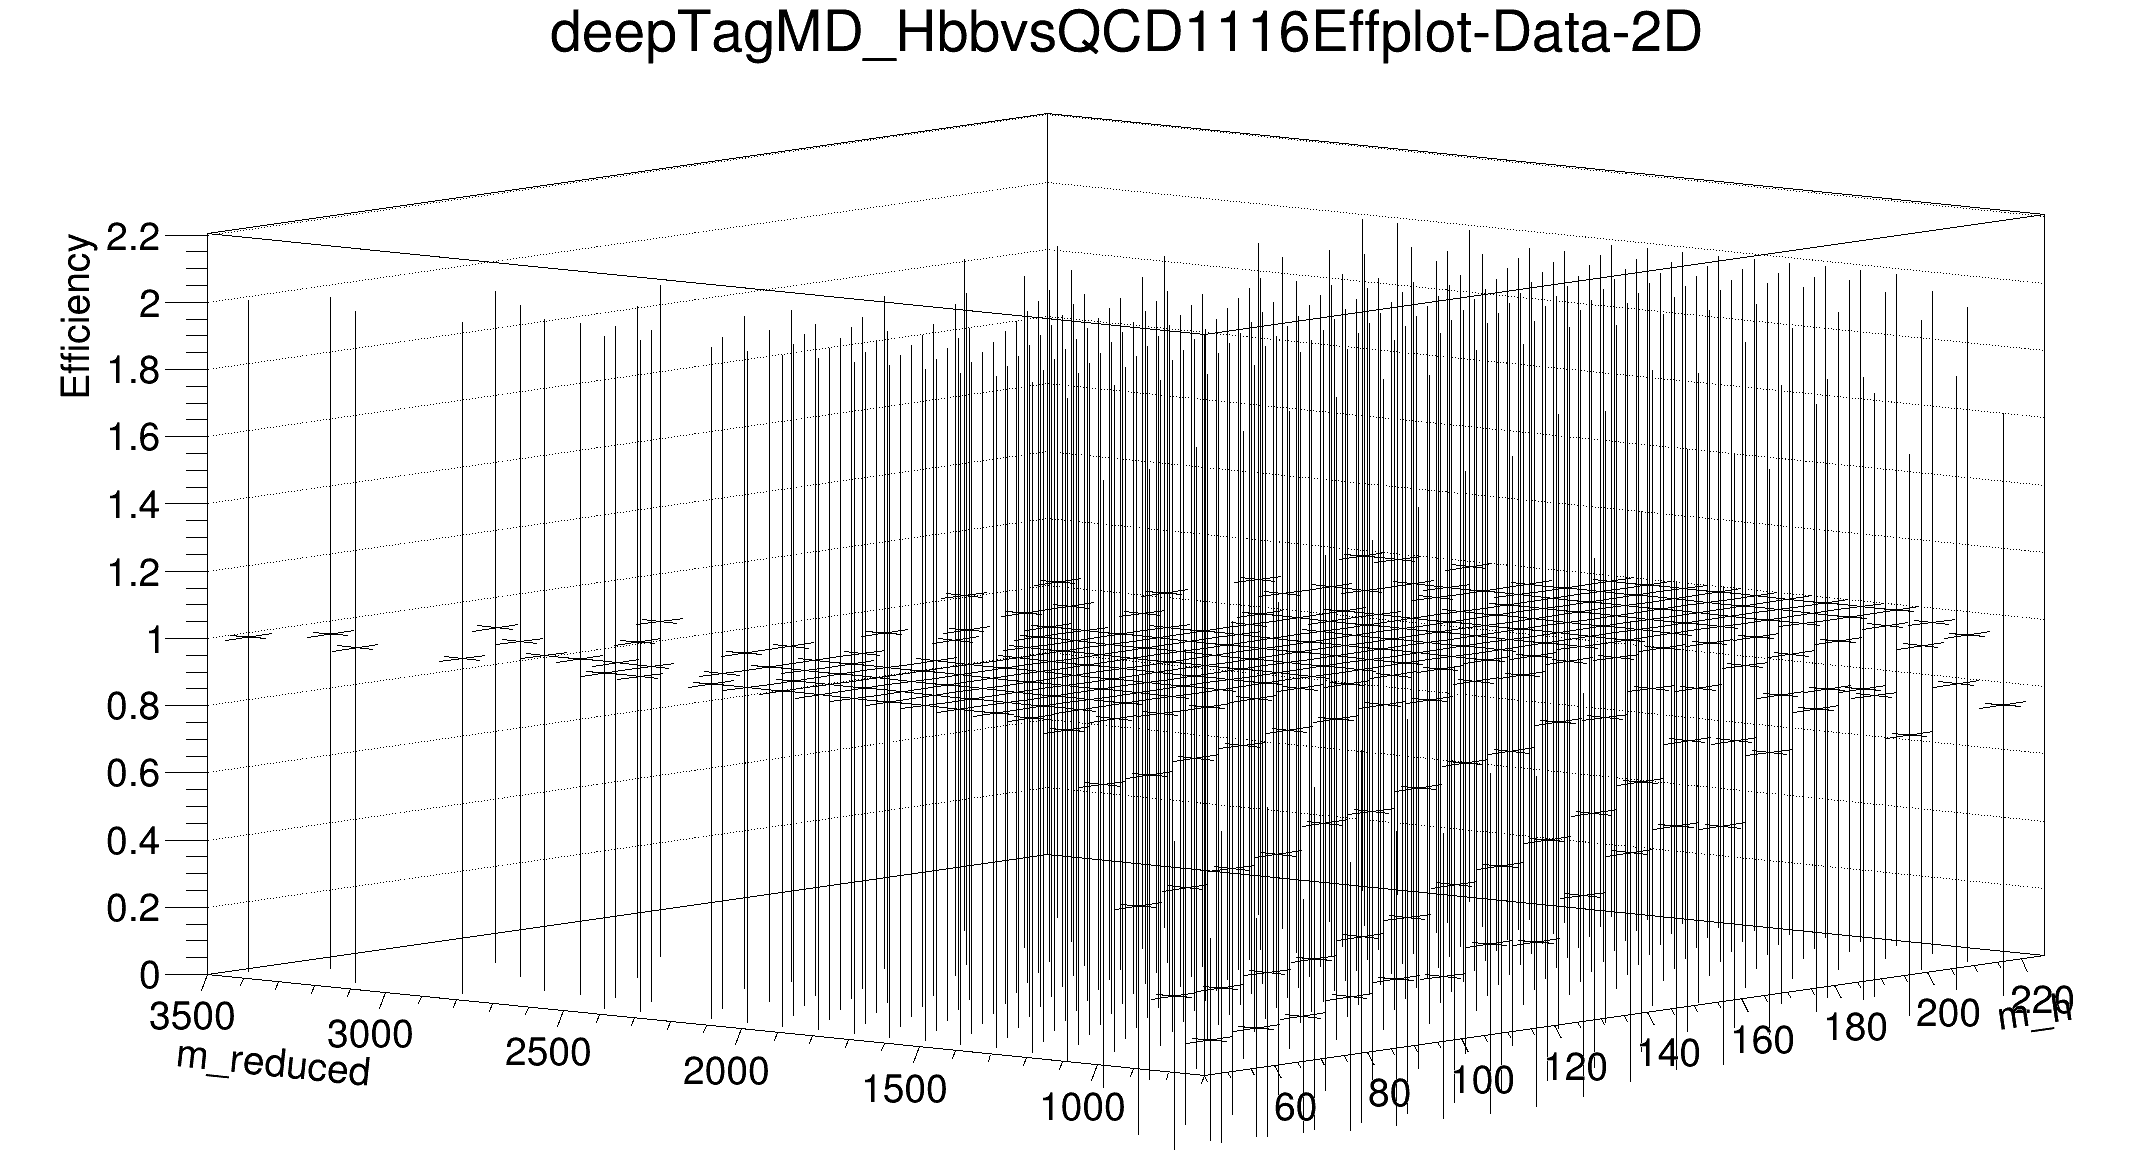
Where what seems weird to me is that the up uncertainties go above 1 and the down go below 0. It was my understanding that statistical uncertainties and the efficiency of each bin is bounded by [0,1] (i.e. even the efficiency + uncertainty up is bounded by 1). Is this expected behavior?? Or did I do something wrong. I am attaching a minimal reproducer and necessary rootfiles. Thanks!

Derek

triggerFiles2Dv7.zip (147.8 KB)


Please read tips for efficient and successful posting and posting code

_ROOT Version: 6.22/07
_Platform: Linux (Ubuntu 20.04 and SLC7)
Compiler: Not Provided


I guess @moneta can help you

Hi,
This is a limitation of the 2D TEfficiency. We don’t have in ROOT a 2D graph with asymmetric errors, so we cannot draw asymmetric errors bars for 2D objects. When using the option E for drawing the TEfficiency object you are just using sqrt(content) as errror. You should not use it and instead get the desired error calling TEfficiency::GetEfficiencyErrorLow(bin) and TEfficiency::GetEfficiencyErrorUp(bin).

Lorenzo

Hi Lorenzo,

Thanks for the clarification. We did code up a work around using the TEfficiency::GetEfficiencyErrorLow/Up methods but our confusion was that it didn’t match this plot. I see now that it shouldn’t. Thanks!

Derek

This topic was automatically closed 14 days after the last reply. New replies are no longer allowed.