Issue to draw a result from fitting using TF1NormSum

Hi all,
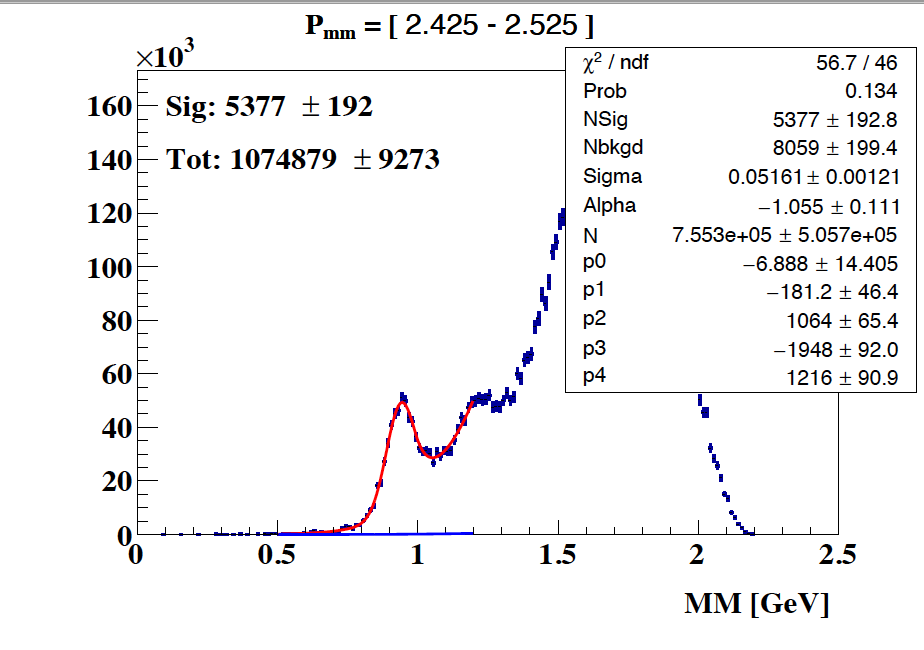
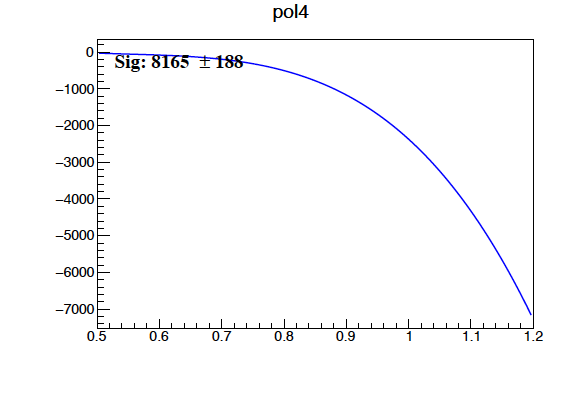
I am using TF1NormSum to fit my data. The result of the fitting looks fine as you see below. I am trying to draw the 2 functions that I used but they show as a line as you see in the attached picture. I have copied the part that I did to draw the functions. Is there something wrong that I did?
Thanks in advance,

****************************************
Minimizer is Minuit2 / Migrad
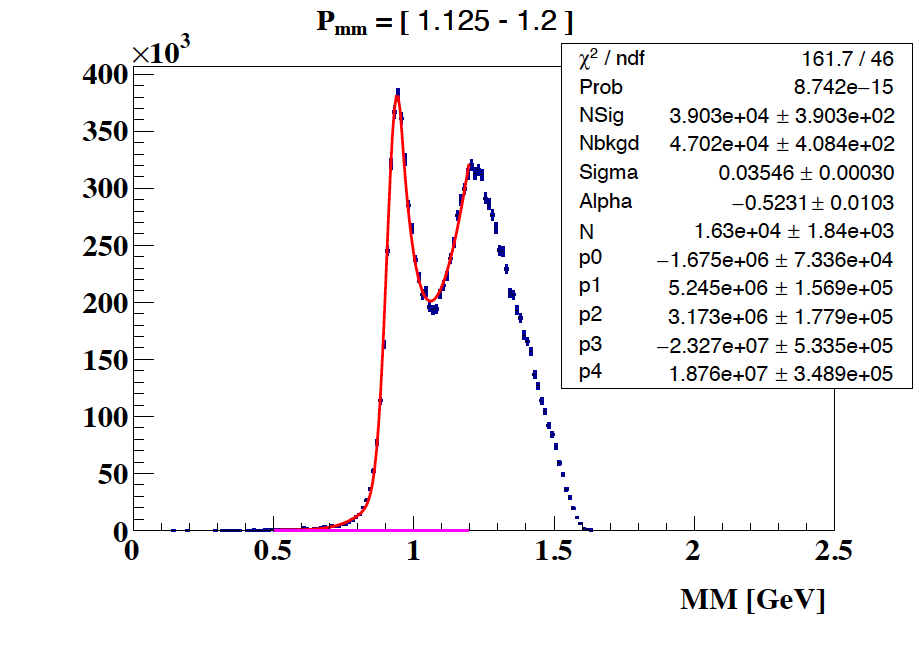
Chi2                      =      161.695
NDf                       =           46
Edm                       =  1.94849e-06
NCalls                    =         2152
NSig                      =      39031.7   +/-   390.32      
Nbkgd                     =      47021.2   +/-   408.417     
Mean                      =        0.939                      	 (fixed)
Sigma                     =     0.035457   +/-   0.00030317   	 (limited)
Alpha                     =    -0.523113   +/-   0.0103072    	 (limited)
N                         =      16304.6   +/-   1842.89      	 (limited)
p0                        = -1.67539e+06   +/-   73357.9     
p1                        =  5.24474e+06   +/-   156862      
p2                        =  3.17266e+06   +/-   177887      
p3                        = -2.32717e+07   +/-   533497      
p4                        =  1.87577e+07   +/-   348942    

# ++++ Plot Signal curve +++++++
    f_crys.SetLineColor(kMagenta)
    for i in range(0,f_crys.GetNpar()):
        f_crys.SetParameter(i,f_sum.GetParameter(i+2))
    integral = f_crys.Integral( 0.5, 1.2)
    f_crys.SetParameter(0, f_sum.GetParameter(0) / integral)
    f_crys.Draw("same")
    print(f_sum.GetParameter(0) / integral)

    # ++++ Plot bkgd curve +++++++
    f_bc.SetLineColor(kBlue)
    for i in range(0,f_bc.GetNpar()):
        f_bc.SetParameter(i,f_sum.GetParameter(i+5))
    f_bc.Draw("same")

Maybe @couet can take a look

Can you provide a script plotting the magenta curve ?

here is the code I used. The background function looks fine and I can draw it. But I still have issue with the amplitude of Crystal ball function.

nsig = 50000
nbkg = 1000000
nEvents = nsig + nbkg
nBins = 1000

signal_mean = 3.0

f_crys = ROOT.TF1("f_crys", "crystalball", 0.5, 1.2)
f_bc = ROOT.TF1("f_bc", "pol4", 0.5, 1.2)


for i in range(1, 2):
    can.cd(1)

    h_sum = hhs.get('detMM_passdcxdcyRmincut_Pmmbin'+str(i))
    f_crys.SetParameters(1000, 0.939, 0.03541, -0.5252, 2000)
    f_bc.SetParameters(1, 1, 1, 1, 1)
    # need to scale histogram with width since we are fitting a density
    h_sum.Draw('')
    print(i,' ', Pmm_bins[i], ' ', Pmm_bins[i+1])
    h_sum.SetTitle('#scale[1]{#bf{#font[22]{P_{mm} = [}}} '+str(Pmm_bins[i])+' - '+str(Pmm_bins[i+1])+'#scale[1]{#bf{#font[22]{ ]}}}')
    
    h_sum.SetXTitle('#scale[1]{#bf{#font[22]{ MM [GeV]}}} ')
    h_sum.SetLineWidth(2)
    h_sum.GetXaxis().SetTitleOffset(1.3);
    h_sum.GetXaxis().SetTitleSize(0.05);
    h_sum.GetXaxis().SetLabelSize(0.05);
    h_sum.GetXaxis().SetLabelFont(22);

    h_sum.GetYaxis().SetTitleOffset(1.2);
    h_sum.GetYaxis().SetTitleSize(0.05);
    h_sum.GetYaxis().SetLabelSize(0.05);
    h_sum.GetYaxis().SetLabelFont(22);

    h_sum.Sumw2()
    h_sum.Scale(1.0, "width")
    
    
    # CONSTRUCTION OF THE TF1NORMSUM OBJECT ........................................
    fnorm_exp_cb = ROOT.TF1NormSum(f_crys, f_bc, nsig, nbkg)
    f_sum = ROOT.TF1("fsum", fnorm_exp_cb, 0.5, 1.2, fnorm_exp_cb.GetNpar())

    parameter_values = fnorm_exp_cb.GetParameters()
    f_sum.SetParameters(parameter_values.data())
    # f_sum.SetParLimits(0, 0, 10000000000)
    # f_sum.SetParLimits(1, 0, 10000000000)
    f_sum.FixParameter(2, 0.939)
    f_sum.SetParLimits(3, 0.03, 0.03636)
    f_sum.SetParLimits(4, -5, 5)
    f_sum.FixParameter(5, 2000)
    

    f_sum.SetParName(1, "Nbkgd")
    f_sum.SetParName(0, "NSig")
    for i in range(2, f_sum.GetNpar()):
        f_sum.SetParName(i, fnorm_exp_cb.GetParName(i))

    # fit - use Minuit2 if available
    ROOT.Math.MinimizerOptions.SetDefaultMinimizer("Minuit2")
    result = h_sum.Fit("fsum", "RSQ")
    result.Print()
    # h_sum.Draw()
    
    # hist.Draw('')
    

    # ++++ Plot Signal curve +++++++
    # # f_crys.SetParameters(1000, 0.939, 0.03541, -0.5252, 2000)
    # f_crys.SetLineColor(kMagenta)
    # f_crys.SetParameter(0, 174618.90210168136)
    # f_crys.SetParameter(1, f_sum.GetParameter(2))
    # f_crys.SetParameter(2, f_sum.GetParameter(3))
    # f_crys.SetParameter(3, f_sum.GetParameter(4))
    # f_crys.SetParameter(4, f_sum.GetParameter(5))
    # # integral = f_crys.Integral( 0.5, 1.2)
    
    # f_crys.Draw('same')
    # # print('integral = ', (f_sum.GetParameter(0) / integral))

    f_crys.SetLineColor(kMagenta)
    for i in range(0,f_crys.GetNpar()-1):
        f_crys.SetParameter((i+1),f_sum.GetParameter(i+2))
        print((i+1), ' par Name: ', f_sum.GetParName(i+2), ' par value:', f_sum.GetParameter(i+2))
    
    integral = f_crys.Integral(0.5, 1.2)
    print('integral = ', integral)

    f_crys.SetParameter(0, f_sum.GetParameter(0)*5)
    f_crys.Draw("same")


    # ++++ Plot bkgd curve +++++++
    f_bc.SetLineColor(kBlue)
    for i in range(0,f_bc.GetNpar()):
        f_bc.SetParameter(i,f_sum.GetParameter(i+6))
        # print(f_sum.GetParameter(i+5))

    f_bc.Draw("same")

    N_sig = int(f_sum.GetParameter(0))
    N_sigErr = int(f_sum.GetParError(0))
    txt = lab.DrawLatex(0.21, 0.83, 'Sig: {0} #pm {1}'.format(N_sig, N_sigErr))
    txt.SetTextFont(22);
    txt.SetTextSize(0.05);


    can.Print("{}".format(mon_name))

can.Print("{}]".format(mon_name))
    ```

hi @couet
I also notice that the total number of event is greater that number of Sig +bkgd. (see the plot)
Here is my way to calculate the total number of events.

bin_width = h_sum.GetBinWidth(1)
    conMatrx = result.GetCovarianceMatrix()
    N_tot = int((abs(f_sum.Integral(0.5, 1.2)))/bin_width)
    N_totErr = int((abs(f_sum.IntegralError(0.5, 1.2)))/bin_width)
    N_totErr2 = (abs(f_sum.IntegralError(0.5, 1.2, f_sum.GetParameters(),conMatrx.GetMatrixArray())))/bin_width

What do you get when you draw f.bc alone, without option same ?

it seems to turn to negative value
Screen Shot 2023-01-16 at 5.24.00 AM

That’s why you do not see in the main plot.

This topic was automatically closed 14 days after the last reply. New replies are no longer allowed.