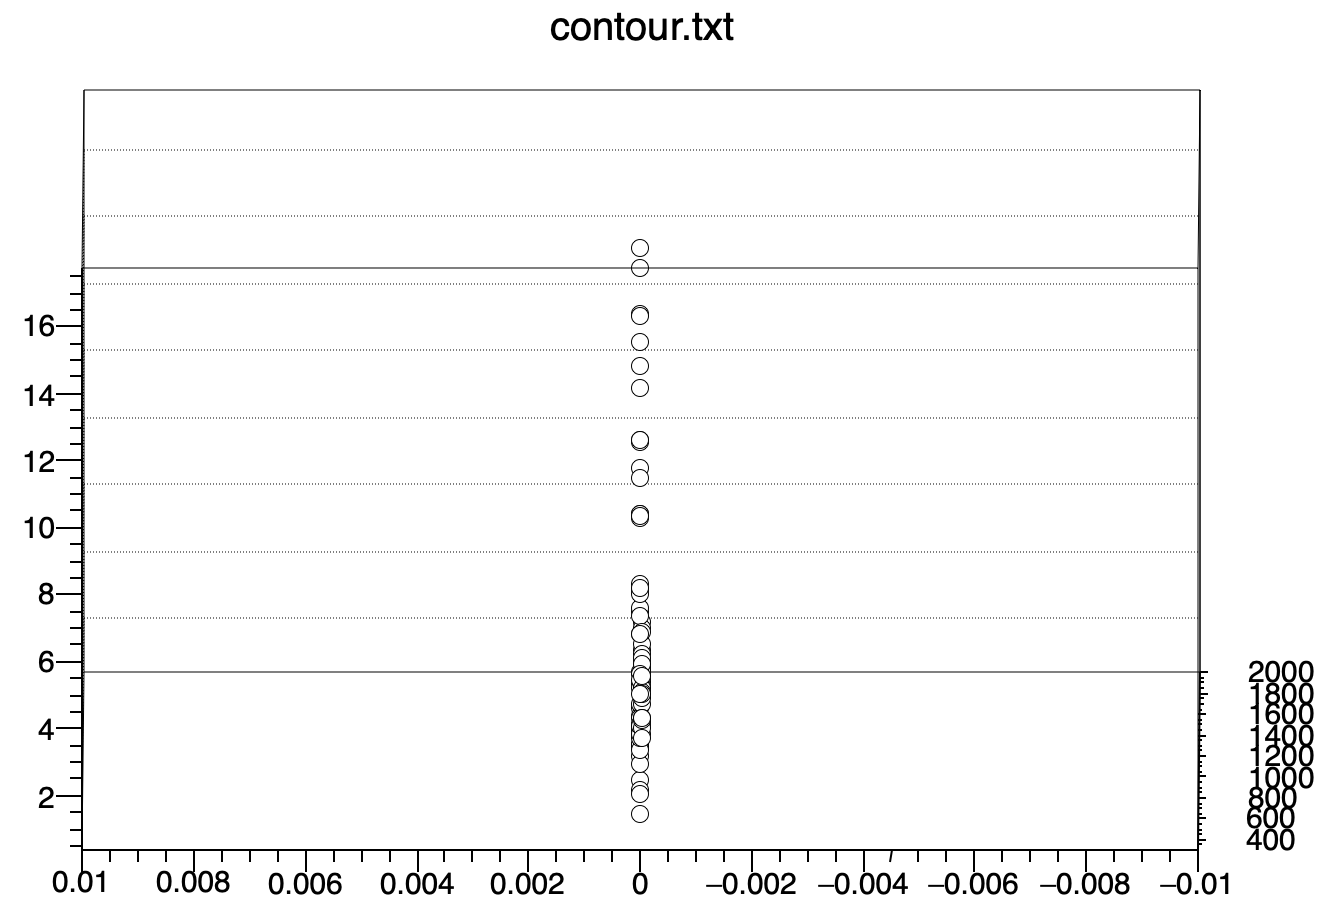
I have attached the sample data file too. What I am getting is a blank canvas. Isn’t it the way to do this?
Will appreciate any help. contour.txt (2.1 KB)
But, as I remember, I have used this code earlier also in ROOT6 (v6.14/04, g++v5.4.0) to plot this kind of graph. This time I don’t why it’s happening.
Anyway, I’ll try to do this ROOT5 and let you know.
From TGraph2D but with some temporary code change. I do not have the proper fix yet. I also tried to find a workaround with the current code but I didn’t un til now. I will work on that today.