However, there are plainly areas with similar values. Perhaps this set is just not suited for Delaunay Triangles, or maybe the order of adding the points to the graph somehow matters? As you can see on the map of triangles, sometimes quite a long triangle is created along the Y axis, crossing (and breaking) an area, that could be rather smoothly interpolated if not broken by this triangle:
like in, for example, area around X:900-1000, Y:3.5-4.5
It’s true that my points are added ordered along the X coordinate. However, if the ordering it’s true, when adding ordered along Y coordinate, I probably would have such “tongues” along the X coordinate… So, is my point set too messy for Delaunay Triangles, or I have to order the points in some clever way?
I do not think the points’ order is important. But as said here: en.wikipedia.org/wiki/Delaunay_triangulation
A Delaunay triangulation is note unique (just think of a square you can have at least two triangulations depending which diagonal is used). May be you can post an example macro reproducing what you get ?
I understand that Delaunay triangulation is note unique, however it works in many cases and here… it doesn’t. The set of points is not that big, so I’m curious, why it does not work. I guess I’ll have to do some kind of manual bilinear interpolation to get rather proper points between real points (btw. it’s a shame that TH2 intepolates just between neighbouring bins, even if they are empty).
Attached is a script and a datafile used for obtaining same results as in the first post. However, you have to rotate graphs manually, for I never mastered the way to rotate them in the code delaunay.C (479 Bytes) par8.txt (1.77 KB)
I have tried to change the order of the points in the file but I always get the same result. Your data generate very long and flat triangles. As this macro shows:
[quote=“couet”]I have tried to change the order of the points in the file but I always get the same result. You data generate very long and flat triangles.
[/quote]
Thanks for your effort. So it seems it’s kind of a “problem” of the triangulation itself. Well, off to other interpolation techniques.
I am not sure it is a problem. The triangles found are correct. May be the Delaunay triangulation as no other way than making these long flat triangles.
Yes, maybe. I ment that the problem is the applicability of this method to my problem However perhaps dividing the dataset into smaller areas will help - this way I can prevent creation of such long triangles. However, the continuity will be a problem.
Seems to me the more point you have the smoother it is. On the other hands you data are really up and down, I found that the interpolation done is not that bad. if you plot with:
g->Draw(“surf1”)
g->Draw(“P0 SAME”);
you see that the surface is a good interpolation of the markers.
True, that the surface is a good interpolation of the markers, but still has a clear preference of “connecting” points vertically, not horizontally, thus unfortunately is rather not close to interpolating the data set in 2D…
Well, I do not think that there is any horizontal or vertical preference. And, your data being what they are I do not see what would be a “better” interpolation ? The two commands I sent you previously clearly show that the interpolation is good.
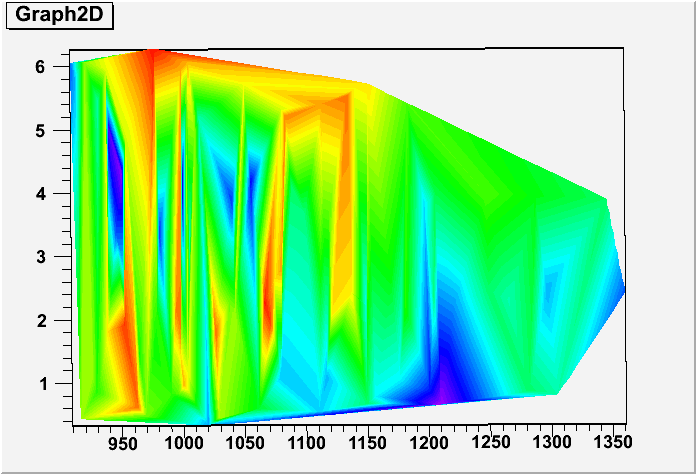
You can see, that for example, there is a horizontal ~red triangle runing from red point around (6.2, 975) to red point around (0.6, 960), crossing the area of blue points spreading from about 950 to 1050 vertically and 3.1 to 4.1 horizontally. The preference is clear, for these blue points are not connected with any “vertical triangles” and there is no red (or even light blue or green) point in between them (either vertically or horizontally). Seems like the alogorithm in this case ignores a bunch of neighbouring blue points, prefering to connect two red points from the other sides of the graph.
More of such situations can be found on this plot.
I found a solution. Perhaps it should be obvious, but wasn’t for me…
The algorithm calculates distances. And the axis which is horizontal on last plots is 0 to 6, while the vertical is about 900 to 1400. That’s why the algorithm prefers to connect points “horizontally” - for event the points from the left and right edges of the plot have a smaller distance between them than a vertical distance of neighbouring points. This would be clearly visible if 1 on the horizontal axis had the same length as 1 on the vertical axis.
I rescaled the horizontal axis to spread over around the same range as vertical axis and now interpolation looks really fine:
I just wonder if this behaviour is a bug or feature? Theoretically it properly calculates the distance and for such a distance it behaves in a proper way. But the case like mine, where units on the X and Y axis are completely different are not uncommon and in such a case the algorithm should assume that the range of axis in X is equal to the range of axis in Y. Perhaps you could add an option to TGraph2D::Draw()?
In principle this algorithm does not assume that the X and Y axis have similar scales. At least I am not aware of this. Can you post the new macro doing this rescaling ?
I just multiplied “axis” parameter by Xrange/Yrange~=500/6~=83. I attach the macro. A completely other problem is, how I really should compare axis ranges, one being radial, the second axial coordinate delun2.C (611 Bytes)
Just a comment, the Delaunay triangulation system was introduced mainly to show altitude levels in mountains.
This means that the coordinate systems x,y have the same units.
The triangulation algorithm cannot work when the range of the axis is vastly different as in your case.
So to make the Delaunay algorithm to work you should normalize your coordinates such that the units are the same.