.
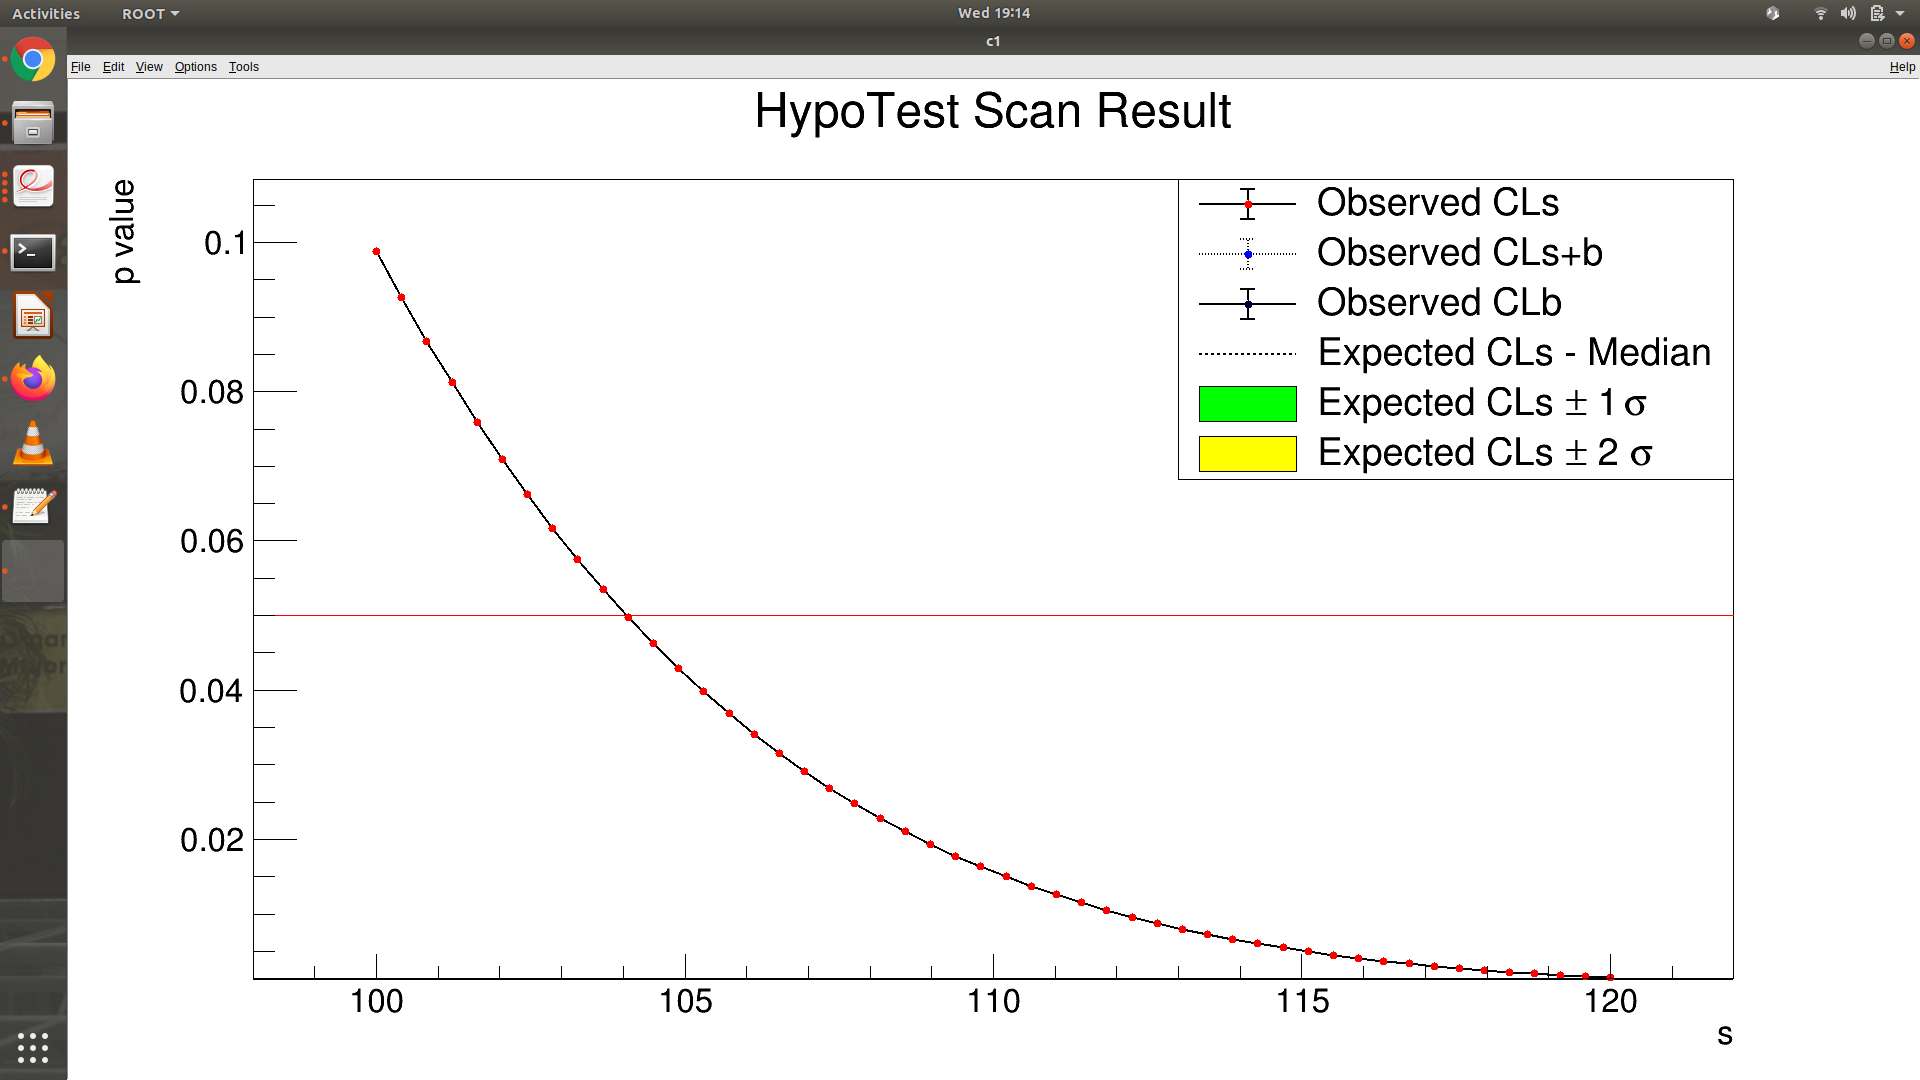
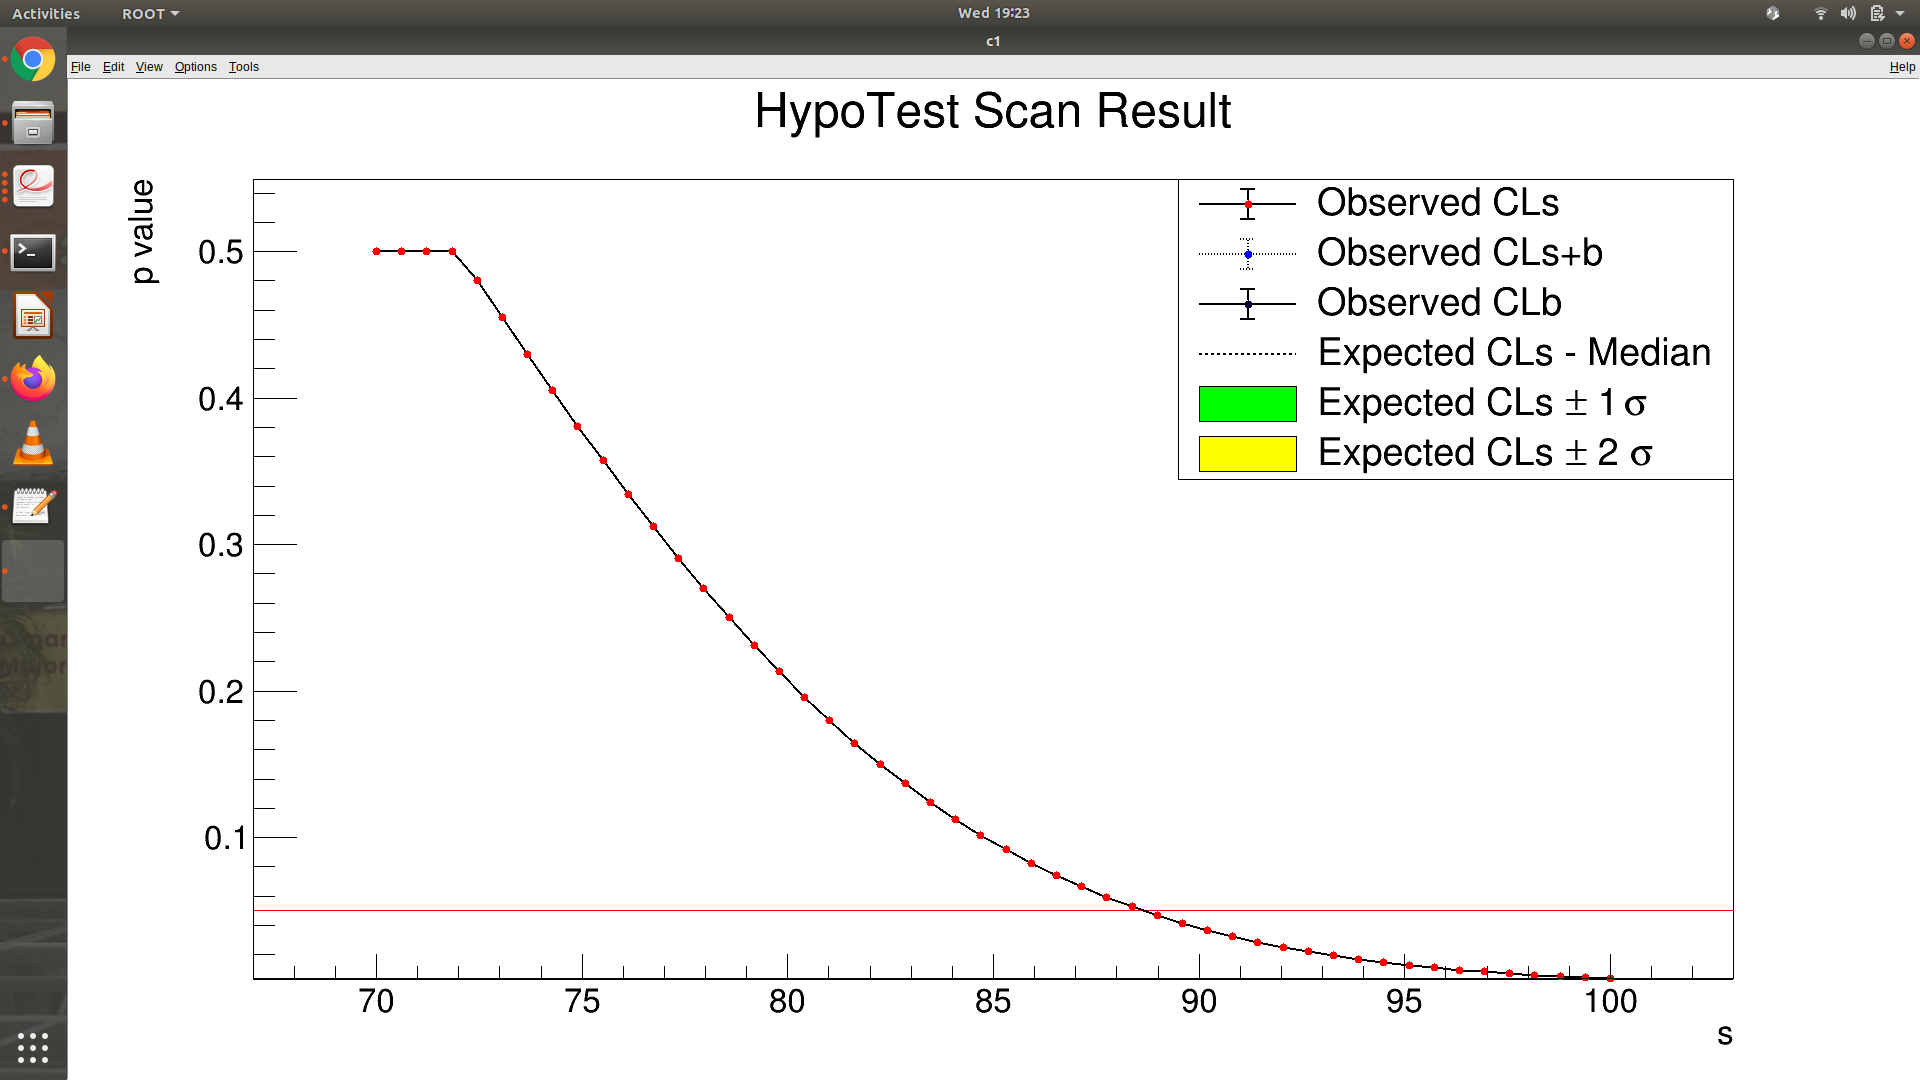
my s[0,226], my question is what is the interpretation of the value of s at which the line p_value 0.05 intersect? because i notice , that when i changed the value of range of s say s[0.,200] the value of s that it overlapse is different.
the value of s at the crossing of the 0.05 line corresponds to the upper 95% confidence interval value (i.e. the 95% upper limit).
If you change the range of s this value in principle should not change. However it is possible it is having a second order effect on the fits and/or the pdf normalisation and that could explain the difference.
. So you mean, because of the change value of the the range of s, the normalization will be affected. So, what will be the best choice of range of a paramater ?
Hi,
If there are no physical reason to have a limited values in s, you should then use the largest possible value… Try for example to increase to 1000 and see if you see still changes by setting it to 2000