I have done some gamma lines search in our data and found no peaks.
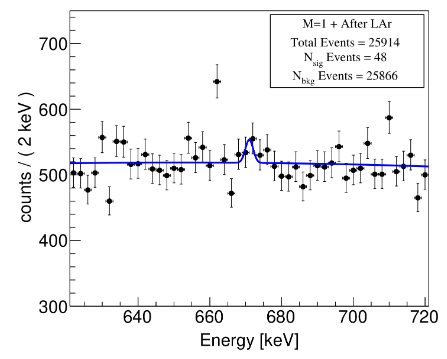
I fitted my data with an extended maximum likelihood fit which gave me a best fit value of “Nsig = 48 counts”.
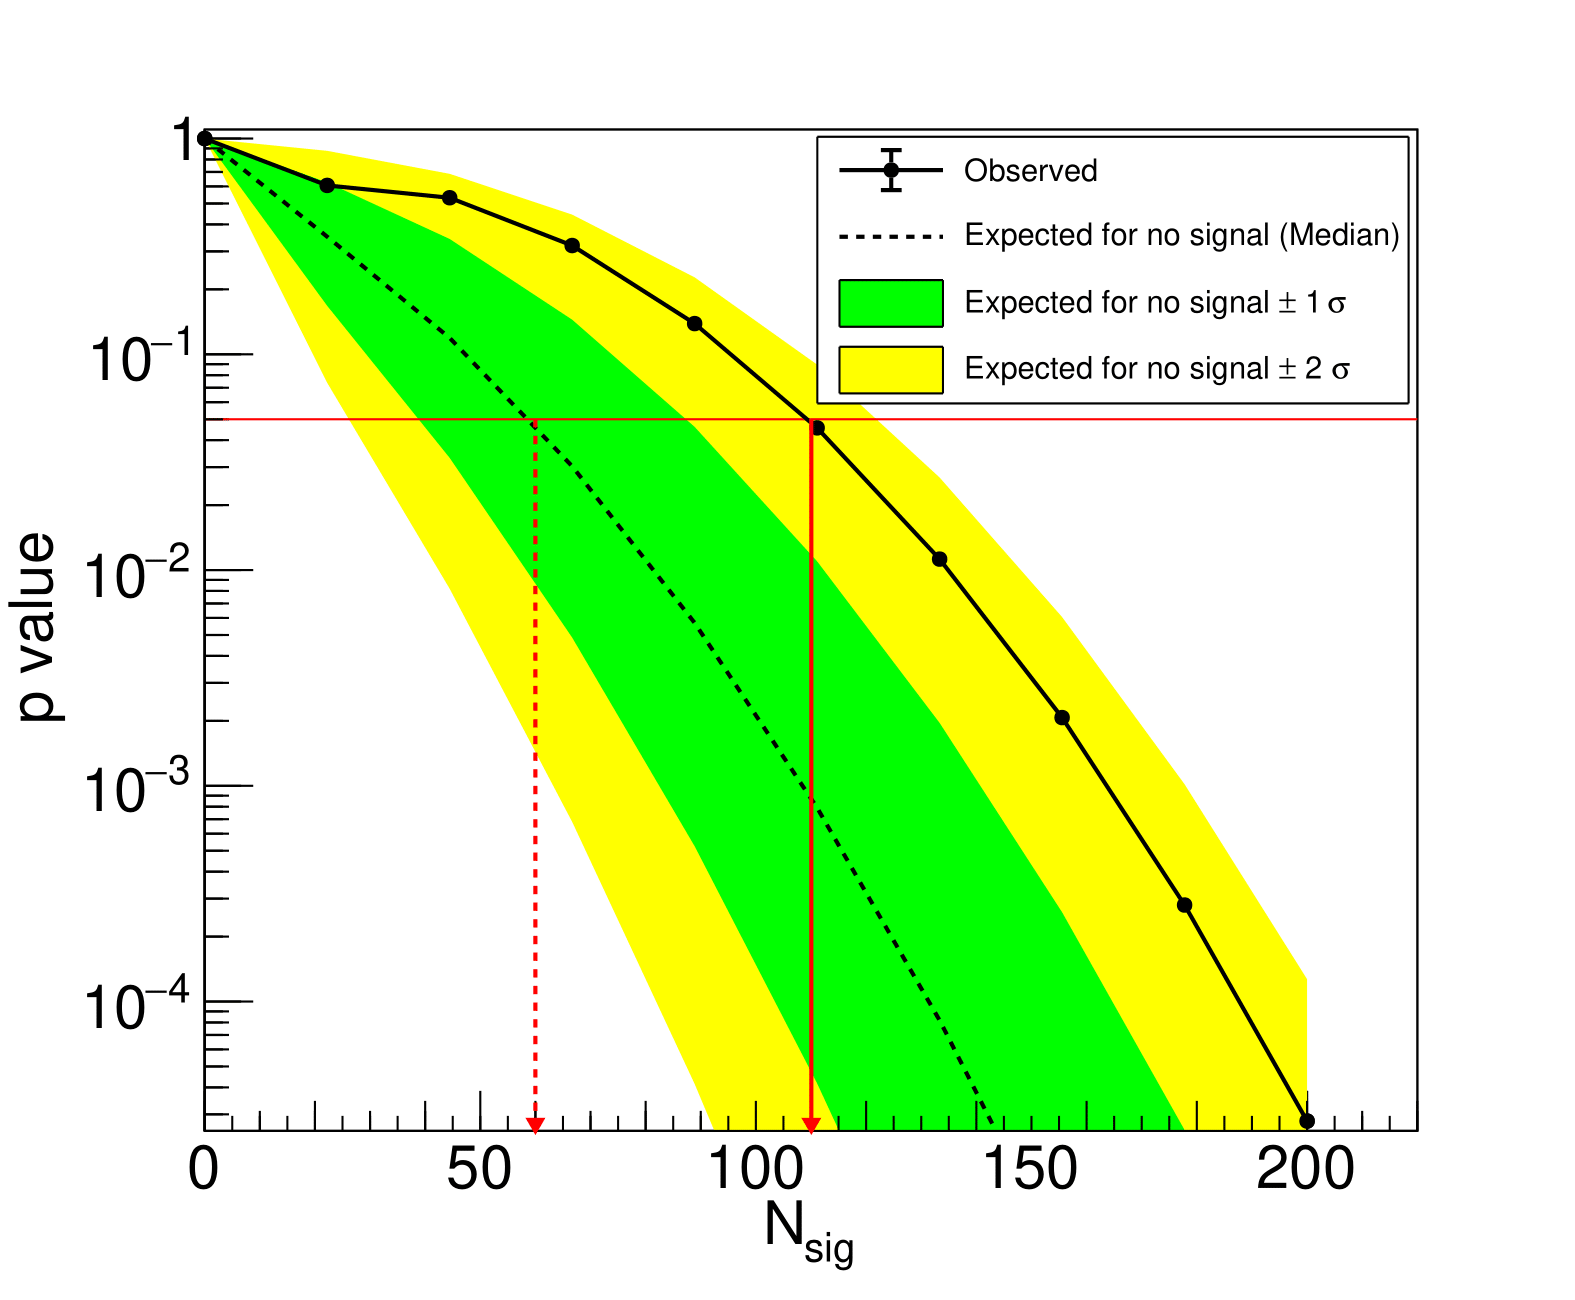
I plotted a p-value plot (Asymptotic approach, profile likelihood test statistics
) which gives me an upper limit of < 110 counts with experimental sensitivity < 64.5
counts.
My question is how do I interpret my results? This is what I understand:
My best fit gives 48 counts but I could have observed this peak in the data if this number of counts (i.e. 48 counts) were greater than the experimental sensitivity limit (64 counts) and the upper limit on Nsignal counts is 110.
Is my interpretation correct for my results? I am attaching here fit and p-value distribution.
64 counts is the median value of your limit that you would obtain if there is no signal (i.e. if your best signal value would be 0), Since you observe 48 signal events, it is natural that your observed upper limit would be higher, which accounts for an upward fluctuation of your background.
Is this answering your question?
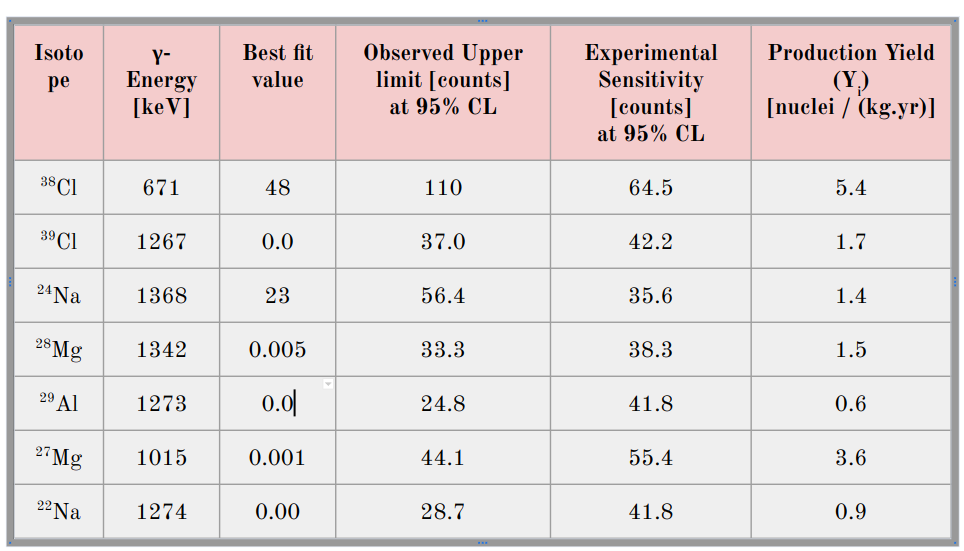
I understand your answer. But then I have results from other isotopes which are shown in this table below.
And you can see here that most of the isotope’s best fit values give 0 counts. And in most of the cases median sensitivity is greater than the observed upper limits. Is it okay?
It is possible that you have median sensitivity larger than the observed one, in case you have negative fluctuations in your data. Probably you have set a lower limit on your observed number of signal events to zero, but actually the best fit value will be negative because you have a positive fluctuations of your background events. This causes a lower than expected upper limit.
Which upper limit method are you using ? If you are using the CLs procedure, there is a correction included in the upper limit calculations to avoid getting an artificial and un-physical too low limit when the negative fluctuations become too large
Actually, i am afraid i don’t have much time at the moment to check this analysis again. I am going to present these results on Thursday to the meeting. What I’m concerned about is that these results should not be wrong and if there is a possible explanation that I could give for expected limits smaller than observed upper limits.