Hello, I am trying to model a 2D data set using RooHistPdf with interpolation order = 2
The ROE_Mbc and mu_pBrest are the two dimensions of the PDF model, and con is the modeled RooHistPdf.
RooRealVar ROE_Mbc("ROE_Mbc","ROE_Mbc",5.1,5.3);
RooRealVar mu_pBrest("mu_pBrest","mu_pBrest",2.1,3.5);
Double_t Mbc_Bins[10] = {5.1,5.14,5.18,5.22,5.26,5.27,5.28,5.2897786,5.2897788,5.3};
RooBinning MbcBins(9,Mbc_Bins,"MbcBin");
mu_pBrest.setBins(10);
mu_pBrest.setRange("Mom_box",2.11,3.49);
ROE_Mbc.setBinning(MbcBins);
ROE_Mbc.setRange("Mbc_box",5.11,5.29);
RooDataHist *dh_con = new RooDataHist("dh_con","dh_con",RooArgList(ROE_Mbc,mu_pBrest),data);
RooHistPdf con("conhist","conhist",RooArgList(ROE_Mbc,mu_pBrest),*dh_con,2) ;
When I try to draw the whole-region 2D PDF, it looks like this
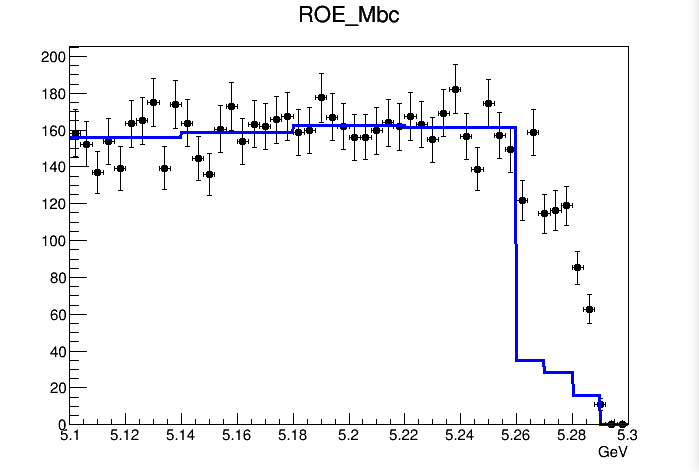
It seems that the interpolation option is useless. The shape of the PDF is not getting smoother.
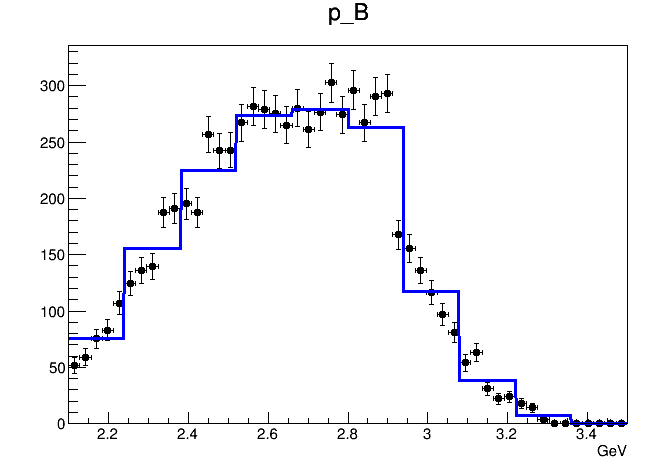
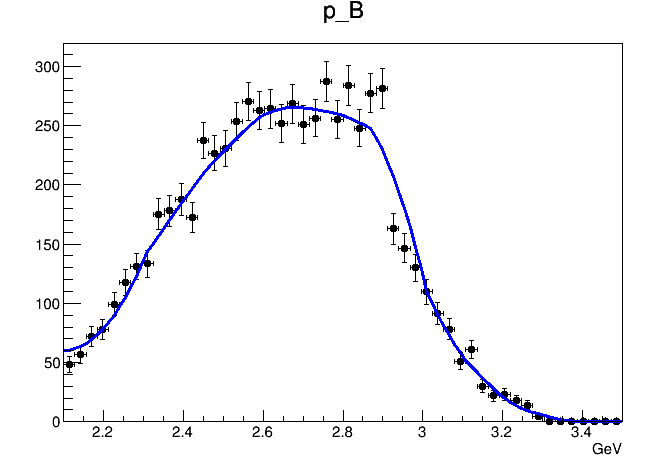
However, if I plot the model in
ProjectionRange("Mom_box") and ProjectionRange("Mbc_box"), the interpolation works.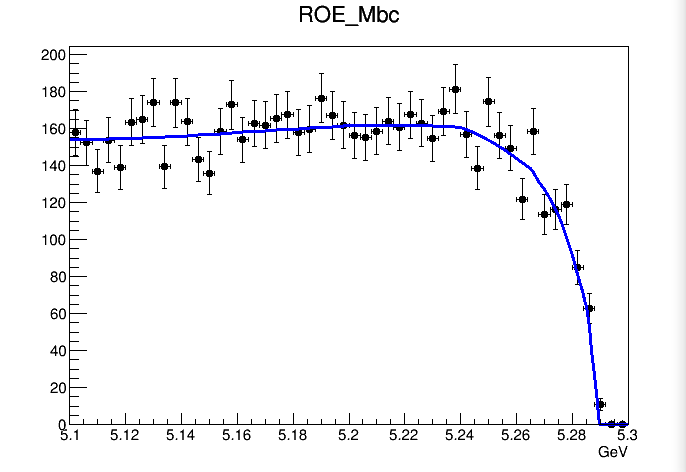
Is this just some kind of plotting feature or is it just illegal to specify interpolation option in 2D histogram PDF?
There is a second question. For the ROE_Mbc dimension, the bin size is different in each bin. In the whole region plot, there is big drop at ROE_Mbc>5.26. This is because for ROE_Mbc>5.26, the size of the bins is smaller, so there is less number of events. I wonder if there is any possibility to normalize each bin according to there bin size (i.e. Can we have for example PdfValueAtCertainBin = NumberOfEventsInThatBin/SizeOfThatBin?). By the way, I don’t see the big drop occurs in the projection plot. I suspect that for some reason the normalization is done in the projection plot.
fitcon2D.C (1.8 KB)