What I am trying to do is an interpolation from a TGraph on a TH2… Actually, what I need is let’s say that if I have
x1(100)y1(100) z=0.6
x2(120)y2(120) z= 0.4
and I draw the TGraph when z>0.5 , that means that it will TGraph the point x1/y1 but this is somehow wrong as I want to somehow interpolate from the 0.4 to 0.6 smoothly…
Is there any implemented tutorial / example ?
Sorry for the naive question and thanks in advance!
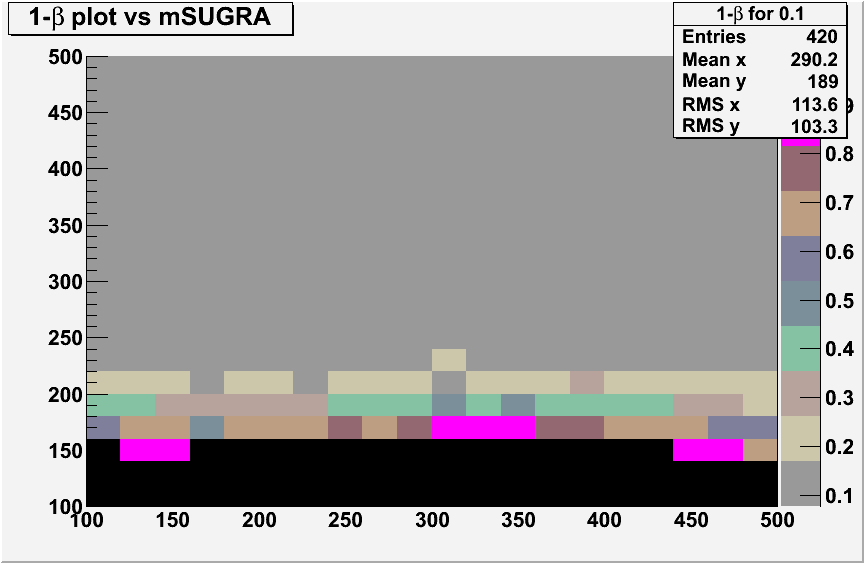
Here is an example (see attachment) where I have a value(step) every 20GeV. I want to plot an exclusion band when for example z>0.4
What I do, is creating a TGraph and just
if (z>0.4)
TGraph->SetPoint(point,x,y)
but obviously, if for example at x1=(200) y1(220) = 0.32 and x2(200) y2(200) = 0.5, then the line from TGraph is shown at (200,200), but I would like to have an interpolation from x1->x2 and y1->y2, so that the exclusion band should be somewhere in the between the x1/x2 y1/y2 points … I guess I should use the function Approx or do I need something else ?
“running” would be impossible as is rather long/complicated, but I put the part that “read” this plot and makes a TGraph one…so the question, how to get the “interpolated” curve for the a pair of values, so that I can have a “smoother” transition
using namespace std;

    TCanvas *c = new TCanvas("c","Exclusion limit",0,0,700,700);


    int main(int argc, char*argv[]){
    gROOT->SetStyle("Plain");
    gStyle->SetPalette(1);
    gStyle->SetOptFit(1111);

    cout << "	" << "========================================================" << endl;
    cout << "	" << "2nd part of TEST OF STATISTICAL PROCEDURE (calculating 1-beta, ...)" << endl;

    TH2F *h1minus_beta_sugra = new TH2F ("1-#beta", "#sigma (pb)", m0Nbins, m0min, m0max, m12Nbins, m12min, m12max);

 TFile *_output;


for (unsigned int ll=100;ll<500;ll=ll+20){
  m0point=m0point+1;

	for (unsigned int kk=100;kk<520;kk=kk+20){

 	  {

		  ///here poweroftest comes from another class, which just returns a statistical probability

		  if (poweroftest>0.5) grin->SetPoint(m0point,ll,kk);
		  " Filled the exclution band plot  "<<m0point<<"  "<<ll<<"  "<<kk<<endl;
	  }

	}}/////////////////// end of loop for m0 m12 points

_output->cd();

TCanvas* c1 = new TCanvas("c1","OneMinusBeta_vs_Fraction "+TString(rootFileNameNullHypo),500,500);
TH1F *frame = new TH1F("frame","",1000,100,500);
   frame->SetMinimum(100);
   frame->SetMaximum(500);
   frame->SetDirectory(0);
   frame->SetStats(0);
   frame->GetXaxis()->SetTitle("m_{0} (GeV)");
   frame->GetXaxis()->SetTickLength(0.02);
   frame->GetXaxis()->SetLabelSize(0.03);
   frame->GetYaxis()->SetTitle("m_{12} (GeV)");
   frame->GetYaxis()->SetMoreLogLabels();
   frame->GetYaxis()->SetLabelSize(0.03);
   frame->Draw(" ");

gr_->SetFillColor(6);
gr_->SetFillStyle(5005);
gr_->SetLineColor(6);
gr_->SetLineWidth(4);
TLatex *tex_plus = new TLatex (300,300,"1-#beta>0.7");
tex_plus->SetTextColor(6);
tex_plus->Draw();
gr_->Draw("C");


c1->Write("OneMinusBeta_vs_Fraction",TObject::kOverwrite);
delete c1;