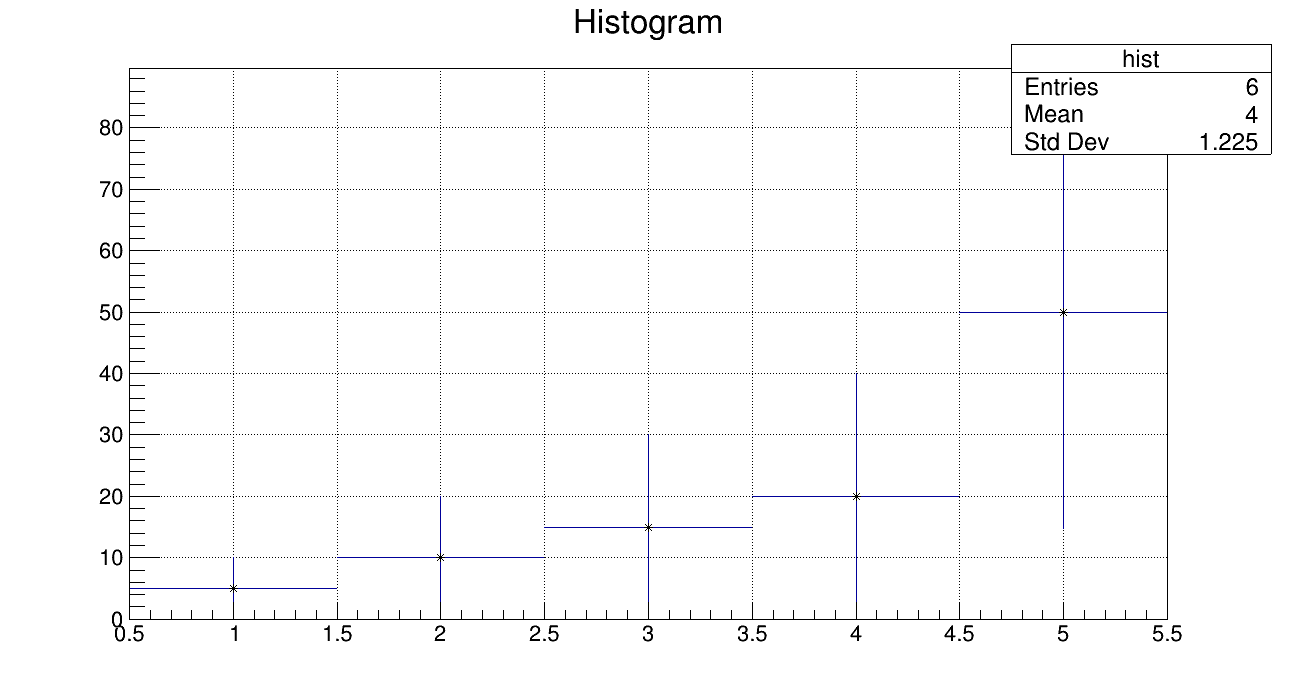
While plotting a histogram from a data file, the last point is not coming out right! As you can see in the first image, the ‘y’ value for ‘x=5’ must be 25 but it comes out to be 50? Where’s the error?
Also, what are these horizontal and vertical blue lines?
And, if I change the number of bins from 5 to 10 the points are plotted incorrectly!(See second attached image below.) Why is this so?
I’ve uploaded all the necessary files below.
Another thing is that, what’s the difference in outcome if I plot the same x and y values using TGraph instead of TH1F?
Thanks @Wile_E_Coyote for your suggestion! I will certainly do that. For the moment, can you please explain what’s the catch here! And, how should I understand the above two results.
Hi @Wile_E_Coyote, Sorry to bother you but can you please explain what is the fundamental difference if I plot (x,y) points one using TGraph and one using hist->Fill(x,y) for TH1F. Does they give the same info or not?
@Wile_E_Coyote I read but the thing that is still not clear is how h1->Fill(x,y) is different from h1->Fill(y). Is it same as TGraph or not? Also, these vertical and horizontal blue bars! Are they errors?
I also Googled it but still unclear!
I know my fundamentals are shaky but it will be grateful if you can help.
In the way you read the last line was read twice.
The histogram are drawn by default with error bars when they are present. The following macro fixes both issues
void sample() {
   ifstream mydat("test2.txt");
   TCanvas* c1 = new TCanvas("c1","Graph");
   float x,y;

   TH1F *hist = new TH1F("hist","Histogram",5,0.5,5.5);

    while(!mydat.eof()) {
      if (mydat >> x >> y) {
         printf("%f %f\n",x,y);
         hist->Fill(x,y);
      }
    }

   hist->SetMarkerStyle(3);
   hist->Draw("HIST P");
   mydat.close();
}
But it seems you are more looking for unbind data. And in that case a TGraph would be more appropriate.
void sample() {
   ifstream mydat("test2.txt");
   TCanvas* c1 = new TCanvas("c1","Graph");
   float x,y;

   auto g = new TGraph();
   int i = 0;

    while(!mydat.eof()) {
      if (mydat >> x >> y) {
         g->SetPoint(i,x,y);
         i++;
      }
    }

   g->SetMarkerStyle(3);
   g->Draw("A P");
   mydat.close();
}
Thanks @couet for replying! I understand where’s the problem.
So do you imply that hist->Fill(x,y) gives the same thing as TGraph, it is just that in the former case the data are binned as opposed to the latter?
If yes, then is there an advantage of one over other?
It is totally up to you. It depends what you need to do. Histogram are meant to produce statistics plots. Graph are (x,y) plots of two arrays.
It seems your case is more a “graph case”.
@couet Actually I was asking in terms of ROOT command. When I put two arguments in 1D Fill() command, just as above, does it plot the points in exactly the same way as a graph does? That is putting a dot at each pair of (x,y) values.
No. The histogram will plot the marker at the bin center whereas the Tgraph will plot the points at the exact position. In your particular case we can make it the same because your points are evenly distributed but that’s not true for the general case.
Thanks @couet ! Now I understand. That’s why in the second image in the original post, when I changed the bin from 5 to 10 the dots are not plotted at exactly x=1,2,3…