Hello. Root experts
CHeers.
Marlon
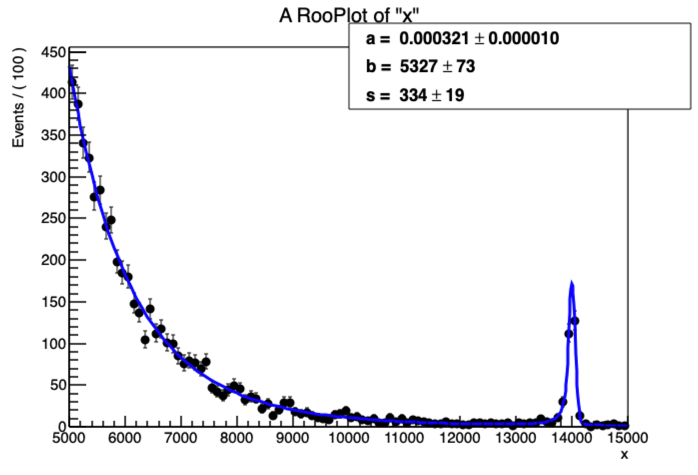
This looks like a fit model that has extreme sensitivity to the amount of signal, s. Is this an (almost) background-free fit? Or a background model without any uncertainties?
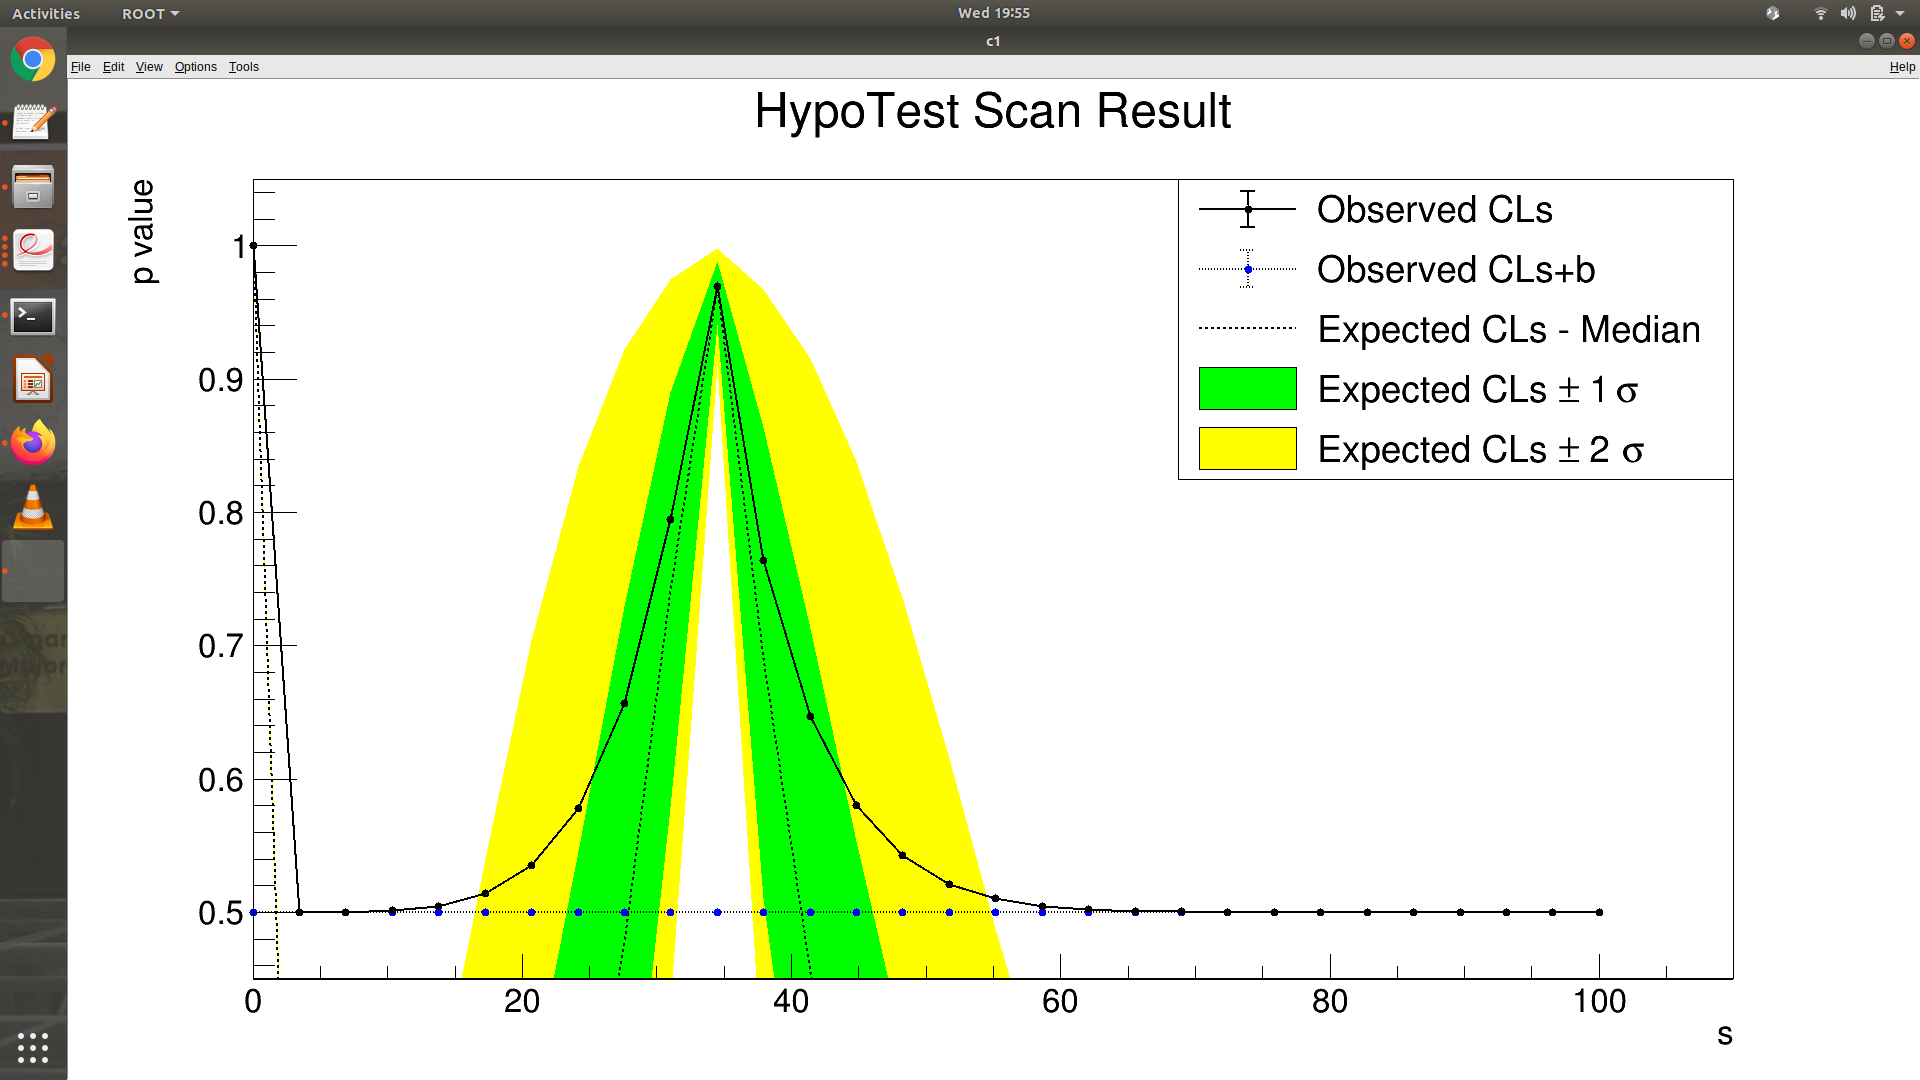
I’m puzzled by the fact that the CLs+b is always 50%. That looks like the background model predicts more data than were actually observed, and that it has no flexibility to correct for any discrepancies. Could there be some kind of inconsistency that e.g.
65 events are observed in data, and the background model predicts 100 +/- 0? In this case, you will always get the same p-values, unless the amount of signal is “just right”.
I’ll also invite @moneta to have a look whether I got this right.
I just notice i have comment out something. But unfortunately , there is still bump like that but this time low signal region. By the way attached is the code. CountingModel2.C (1.7 KB) SimpleHypoTestInv2.C (3.8 KB). Would you mind checking it?
I think it’s what I suspected: It’s essentially a background-free experiment. @moneta, does it make sense to run the HypoTest scanner here? Especially if it’s set to one-sided?
Hi,
It make sense to run the HypoTestInverter scan but you need to set a double side likelihood ratio test statistics and use only CL(S+B). This is a Feldman Cousins interval determination if using toys, while if using the asymptotic and you are not close to the bounds it is exactly equivalent to the profile likelihood (Minos) interval computation.
A one-side likelihood ratio test and CL(s) makes sense only for setting upper limit. If you observe a significant signal, such as your case, it has no sense anymore setting an upper limit, but you want to set a confidence interval.
Best regards
Lorenzo
Hello.
Thank you for your response sir. Let me clarify sir.
So instead of using HypoTestInverter, i do determine the confidence interval using Feldman Cousin. Then to get the ±1 sigma band, i just set the interval to 0.68 and for ±2, i set it to 0.95.
Further, Is it reasonable to define the center of the interval as the median expected in this case?
Cheers,
Marlon
Hi,
You can still use the HypoTestInverter, but the interpretation will be different and you need to use CL(S+B) and double side test statistics.
The CL(S+B) curve will have a peak at 1 and will growth from the left and decrease on the right of the peak. The value where is crossing the 0.32 (or 0.05) lines will be the lower and upper end of the interval. The central value will be the best fit value of your parameter of interest. For the best fit value, by definition the test statistics will be equal to 0 and CL(S+B) = 1
Cheers
Lorenzo
Thank you sir.
Hello sir.
By the way, what about the case near the boundary, the signal there is very small, in this case if i used double side test statistic, there might be a case where my lower limit is in negative values. What can i do in this case? Is it okay now to set upper limit in this case since the number of signal is not significant anymore?
It depends what you want. If you know from physics reasons that the signal cannot be negative, it is perfectly fine to set an upper limit, and just assume that the signal is always >= 0.