Dear rooters,
I am not sure if there is built-in functionality that allows users to draw markers with different colors (and/or size), and then show a Palette to indicate the scale for the color (or size).
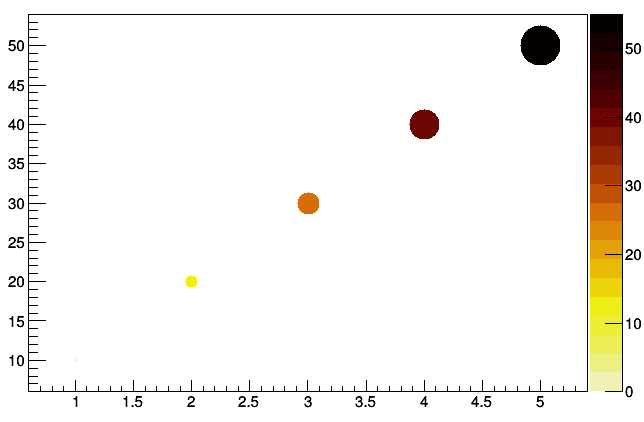
Here is the graph for demo:
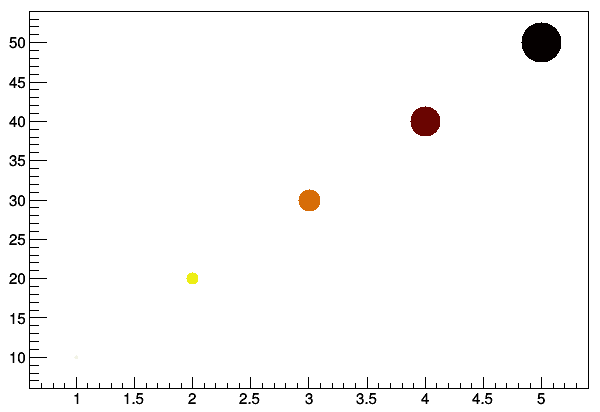
My method is to use TGraph object to draw a box with only two points, and
then draw many TMarker objects at the same canvas.
But I cannot figure out how to create a TPaletteAxis to illustrate the scale.
I am very appreciative if you could give some hints to me.
Thank you very much.
The following are example codes:
class myTGraph : public TGraph
{
private:
//=======================================
// for color palette
Int_t* fPaletteColor; // size = fPaletteColorN
Int_t fPaletteColorN;
//=======================================
//=======================================
// for user input data
vector<Double_t> fXs;
vector<Double_t> fYs;
vector<Double_t> fCs;
//========================================
Double_t fSize1;
Double_t fSize2;
vector<TMarker> fMarkers;
public:
myTGraph() : TGraph() {};
~myTGraph(){};
/*!
@param paletteColor, int*, each element is color index.
@param ncolors, int, the size of palette color.
*/
void SetPalette( Int_t ncolors, Int_t* paletteColor ) {
fPaletteColor = paletteColor;
fPaletteColorN = ncolors;
};
void SetMarkerSizeRange( Double_t size1, Double_t size2 ){
if( size1>size2 ){
fSize2 = size1;
fSize1 = size2; }
else{
fSize1 = size1;
fSize2 = size2;
}
}
/*!
@param pointN, int, for the size of the x,y,and c array.
*/
void SetPoints( Int_t pointN, Double_t* x, Double_t* y, Double_t* c )
{
for( int i =0; i< pointN; i++ ){
fXs.push_back( x[i] );
fYs.push_back( y[i] );
fCs.push_back( c[i] );
}
Double_t xMin, yMin, xMax, yMax;
xMin = * min_element( fXs.begin(), fXs.end() );
xMax = * max_element( fXs.begin(), fXs.end() );
yMin = * min_element( fYs.begin(), fYs.end() );
yMax = * max_element( fYs.begin(), fYs.end() );
SetPoint( 0, xMin, yMin );
SetPoint( 1, xMax, yMax );
};
void Draw2( Option_t * option = ""){
TString opt = option; opt.ToLower();
bool drawSize = false;
if( opt.CompareTo("c") == 0 ){
drawSize = true;
if( fSize1 <= 0 and fSize2 <= 0 )
{
fSize1 = 1.;
fSize2 = 3.;
}
}
TGraph::Draw( "AP" ); // Draw the box
Double_t cStep;
Double_t cMin = * min_element( fCs.begin(), fCs.end() );
Double_t cMax = * max_element( fCs.begin(), fCs.end() );
cStep = (cMax - cMin)/ fPaletteColorN;
fMarkers.clear();
for( int i =0; i< fXs.size(); i++ )
{
Double_t x = fXs.at(i);
Double_t y = fYs.at(i);
TMarker m;
m.SetMarkerStyle(20);
//=====================================================
// setting colors and sizes for the markers
Int_t idx = int( ( fCs.at(i) - cMin - 1E-4)/cStep ) ;
m.SetMarkerColor( fPaletteColor[idx] );
if( drawSize ) {
Double_t mSize
= fSize1 + (fSize2 - fSize1) * idx / fPaletteColorN;
//note idx ranges from 0 to (fPaletteColor-1)
m.SetMarkerSize( mSize );
}
//=====================================================
m.DrawMarker( x, y );
fMarkers.push_back( m );
m.Draw("same");
}
};
};
void demo(){
gStyle->SetOptStat( 0 );
//================================================================
// create colors
// new color indices are stored in myColor_idx[]
// with size = colorN
Double_t red[9] = { 242., 234., 237., 230., 212., 156., 99., 45., 0.};
Double_t green[9] = { 243., 238., 238., 168., 101., 45., 0., 0., 0.};
Double_t blue[9] = { 230., 95., 11., 8., 9., 3., 1., 1., 0.};
// note: total color N = subDivN * 8
int subDivN = 8;
const Int_t colorN = subDivN * 8 ;
Int_t* myColor_idx = new Int_t [ colorN ];
TColor** myColor = new TColor*[ colorN ];
int iColor = 0;
for( int i=0; i<(9-1); i++ ){
Double_t red1 = red[i]; Double_t red2 = red[i+1];
Double_t green1 = green[i]; Double_t green2 = green[i+1];
Double_t blue1 = blue[i]; Double_t blue2 = blue[i+1];
if( iColor==0 ){
myColor_idx[0] = TColor::GetFreeColorIndex();
myColor[0] =
new TColor( myColor_idx[0], red[0]/255., green[0]/255., blue[0]/255. );
iColor += 1;
}
for( int j=0; j<subDivN; j++ ){
Double_t _red = red1 + ( red2-red1 )* ( j+1 )/subDivN;
Double_t _green = green1 + ( green2-green1 )* ( j+1 )/subDivN;
Double_t _blue = blue1 + ( blue2-blue1 )* ( j+1 )/subDivN;
myColor_idx[ iColor ] = TColor::GetFreeColorIndex();
myColor[ iColor] =
new TColor( myColor_idx[iColor],
_red/255., _green/255., _blue/255. );
iColor += 1;
}
}
//====================================================================
if( 1 ){
myTGraph* gr = new myTGraph();
Double_t xs[5] = { 1, 2, 3, 4, 5 };
Double_t ys[5] = { 10, 20, 30, 40, 50 };
Double_t cs[5] = { 11, 22, 33, 44, 55 };
gr->SetPalette( colorN, myColor_idx );
gr->SetMarkerSizeRange( 0.5, 5 );
gr->SetPoints( 5, xs, ys, cs );
gr->Draw2( "c" );
}
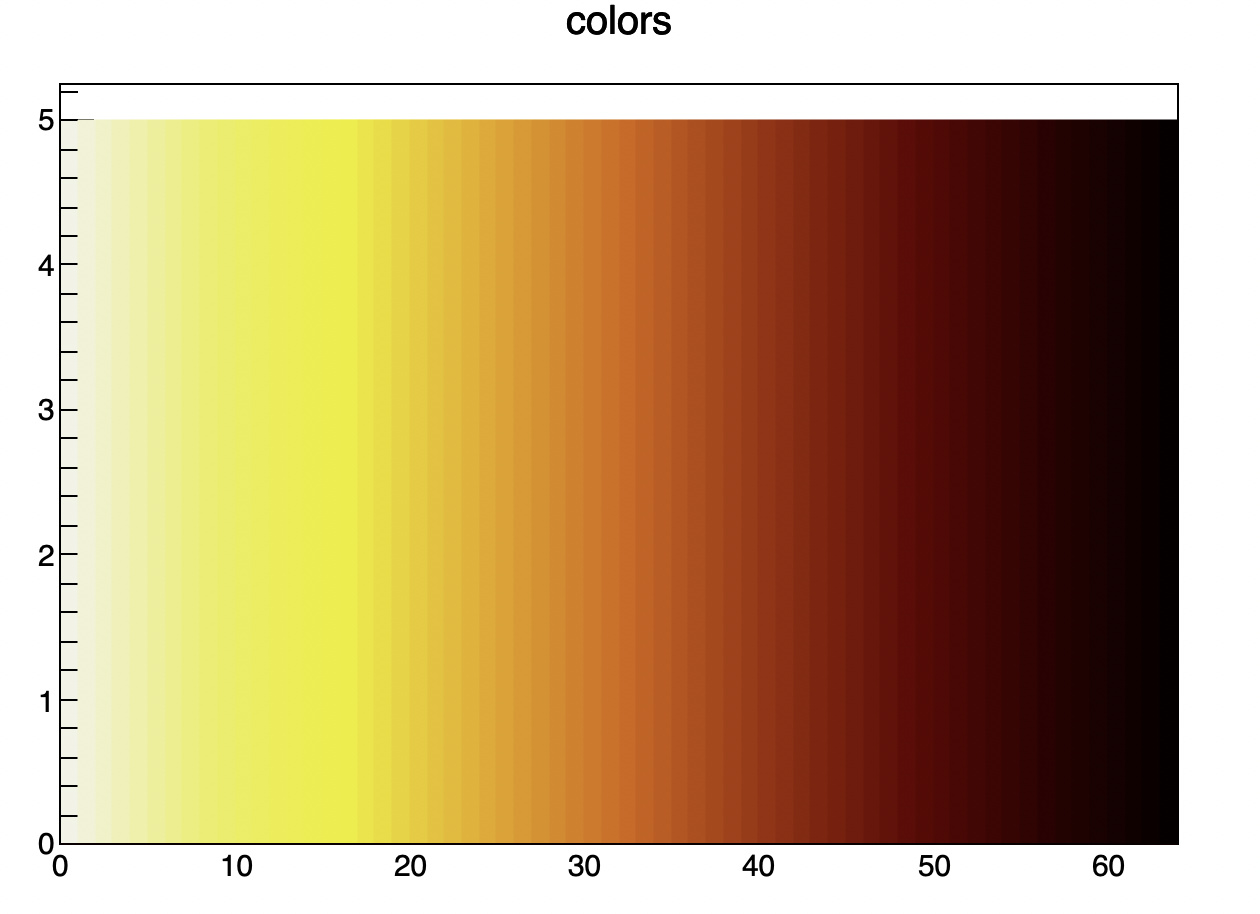
// visualizing the color
if( 1 )
{
new TCanvas();
TH1F* histo[colorN];
for( Int_t i = 0; i<colorN; i++ )
{
histo[i] =
new TH1F( Form("histo%d",i), Form("histo%d",i), colorN, 0,colorN );
for( Int_t j=0; j<5; j++ ){ histo[i]->Fill(i); }
}
histo[0]->Draw(); histo[0]->SetTitle("colors");
for( Int_t i = 1; i<colorN; i++ )
{
histo[i]->Draw("same");
}
for( Int_t i = 0; i<colorN; i++ ){
// histo[i]->SetLineColor( currentPalette.GetAt(i) );
histo[i]->SetFillStyle( 1001 );
histo[i]->SetFillColor( myColor_idx[i] );
histo[i]->SetLineColor( myColor_idx[i] );
}
}
}
ROOT Version: 6.12
Platform: Ubuntu 14.04
Compiler: gcc