ROOT Version: Not Provided Platform: Not Provided Compiler: Not Provided
Hi,
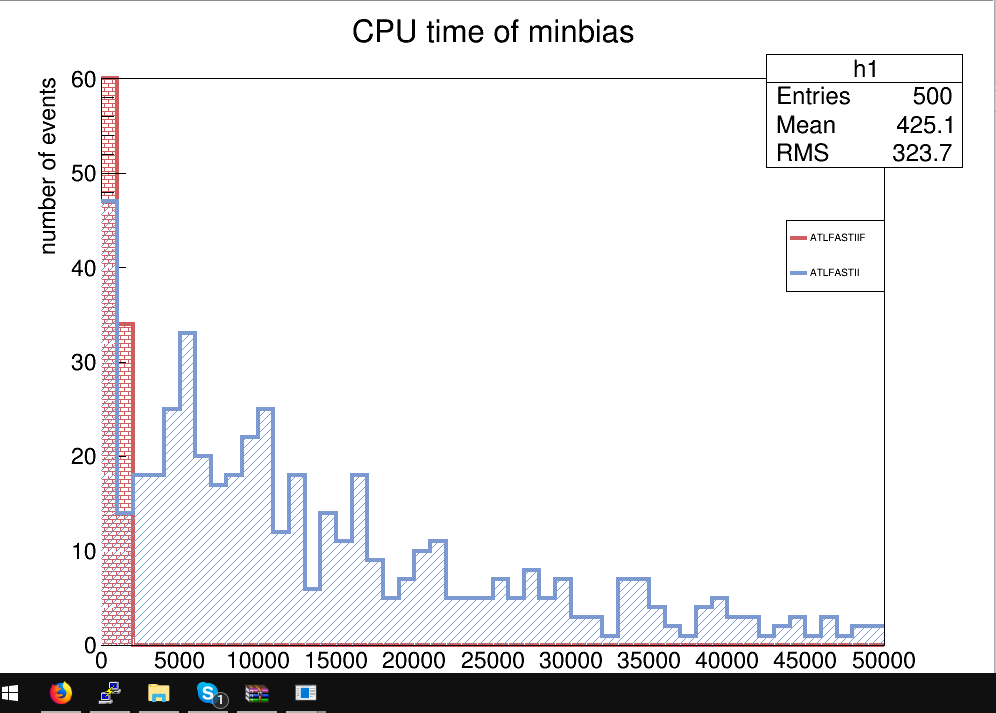
I am attempting to plot two histograms on the same axis, however the information on the two data files differ drastically such that I get something like this:
My code using pyroot is something along the lines of:
h1 = ROOT.TH1F(‘h1’, ‘CPU time ATLFASTIIF’,50, 0, 50000)
h2 = ROOT.TH1F(‘h2’, ‘CPU time ATLFASTII’,50, 0, 50000)
c1 = ROOT.TCanvas(‘Histogram’, ‘CPU time minbias’, 1000,1000)
gPad = c1.cd(1)
gPad.SetLogx()
h1.Draw()
h2.Draw(‘SAME’)
How do I make it so that I get 50 bins for the red and 50 bins for the blue at the same time?
I’ve put in 50 bins in h1, but what I want is a nice distribution at the lower range in the log scale, and a nice distribution at the higher end which I cannot seem to get.
Hi,
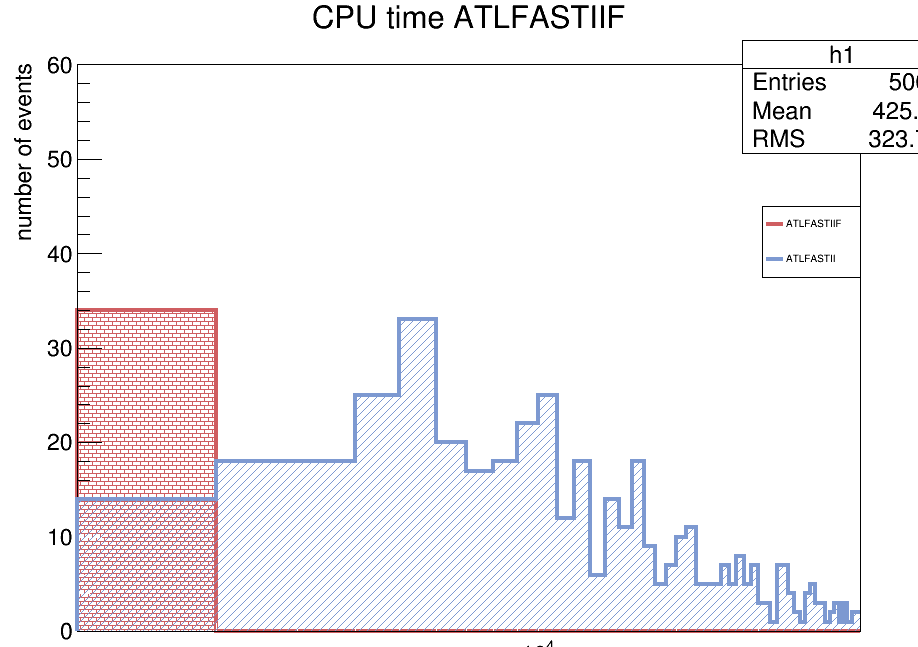
Since the red histogram haven’t any event above 2000, I see only two solutions for you.
Increasing the number of bins of both histograms to 1250, in this way you have 50 bins from 0 to 2000.
Otherwise you can use this TH1::TH1() declaration for the two histograms. You use a vector for the lower edge of the bins, in this way you can create bins with a increasing logarithmic width.