Hello,
Instead of doing the task as described here
root.cern.ch/phpBB2/viewtopic.php?t=10230
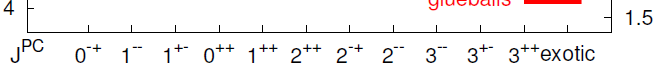
I want to start from something more “simple”, just draw the spectrum in a 2-D histogram. But the first problem is how to use latex in labels (as in the attached plot). It seems both TText and TLatex need (x, y) positions, that is not very convenient. It is possible to do the similar thing as:
root.cern.ch/root/html524/tutori … is2.C.html
Or there is a more smart way? A simple example will be greatly appreciated.
Many thanks in advance.
Cheers, Jibo